PcsTech 517119 full analysis,charts,indicators,moving averages,SMA,DMA,EMA,ADX,MACD,RSIPcs Tech 517119 WideScreen charts, DMA,SMA,EMA technical analysis, forecast prediction, by indicators ADX,MACD,RSI,CCI BSE stock exchange
Daily price and charts and targets PcsTech Strong Daily Stock price targets for PcsTech 517119 are 24.63 and 26.13 | Daily Target 1 | 24.25 | | Daily Target 2 | 25 | | Daily Target 3 | 25.75 | | Daily Target 4 | 26.5 | | Daily Target 5 | 27.25 |
Daily price and volume Pcs Tech
| Date |
Closing |
Open |
Range |
Volume |
Tue 02 September 2025 |
25.75 (0.08%) |
26.24 |
25.00 - 26.50 |
2.0247 times |
Mon 01 September 2025 |
25.73 (3.46%) |
28.99 |
24.20 - 28.99 |
2.1453 times |
Fri 29 August 2025 |
24.87 (-1.35%) |
25.21 |
24.62 - 25.21 |
0.2102 times |
Thu 28 August 2025 |
25.21 (1.37%) |
27.90 |
24.80 - 27.90 |
0.8955 times |
Tue 26 August 2025 |
24.87 (-2.81%) |
26.48 |
24.61 - 26.48 |
1.2682 times |
Mon 25 August 2025 |
25.59 (-0.93%) |
26.47 |
25.50 - 26.75 |
0.7116 times |
Fri 22 August 2025 |
25.83 (0.27%) |
25.76 |
25.76 - 26.25 |
0.3875 times |
Thu 21 August 2025 |
25.76 (-0.92%) |
26.00 |
25.50 - 26.37 |
0.7715 times |
Wed 20 August 2025 |
26.00 (0%) |
26.50 |
25.25 - 26.50 |
0.4343 times |
Tue 19 August 2025 |
26.00 (2.48%) |
25.75 |
25.00 - 26.72 |
1.1514 times |
Mon 18 August 2025 |
25.37 (3.85%) |
24.92 |
24.28 - 25.73 |
0.5979 times |
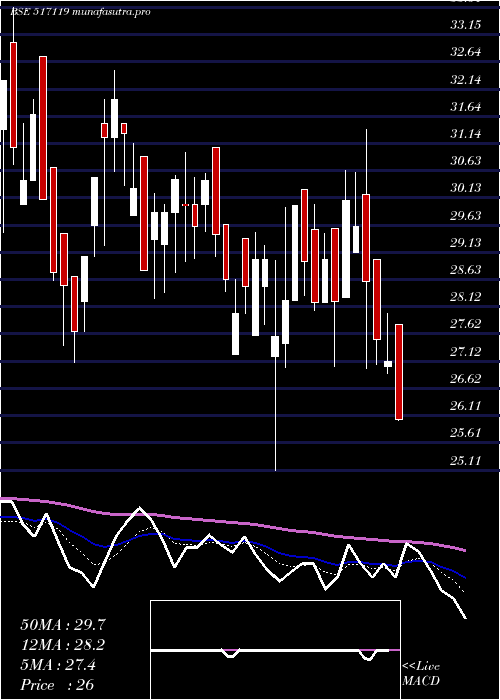
Weekly price and charts PcsTech Strong weekly Stock price targets for PcsTech 517119 are 22.58 and 27.37 | Weekly Target 1 | 21.52 | | Weekly Target 2 | 23.64 | | Weekly Target 3 | 26.313333333333 | | Weekly Target 4 | 28.43 | | Weekly Target 5 | 31.1 |
Weekly price and volumes for Pcs Tech
| Date |
Closing |
Open |
Range |
Volume |
Tue 02 September 2025 |
25.75 (3.54%) |
28.99 |
24.20 - 28.99 |
1.365 times |
Fri 29 August 2025 |
24.87 (-3.72%) |
26.47 |
24.61 - 27.90 |
1.0099 times |
Fri 22 August 2025 |
25.83 (5.73%) |
24.92 |
24.28 - 26.72 |
1.0941 times |
Thu 14 August 2025 |
24.43 (-4.38%) |
28.00 |
23.58 - 28.00 |
0.9327 times |
Fri 08 August 2025 |
25.55 (-0.27%) |
24.01 |
24.01 - 26.98 |
0.6618 times |
Fri 01 August 2025 |
25.62 (-3.1%) |
27.00 |
25.00 - 29.00 |
0.8934 times |
Fri 25 July 2025 |
26.44 (-2.04%) |
26.99 |
26.20 - 30.98 |
0.5426 times |
Fri 18 July 2025 |
26.99 (-0.74%) |
27.73 |
26.05 - 27.73 |
0.893 times |
Fri 11 July 2025 |
27.19 (-0.73%) |
27.90 |
26.40 - 27.90 |
1.2123 times |
Fri 04 July 2025 |
27.39 (-1.97%) |
28.30 |
26.40 - 29.00 |
1.3951 times |
Fri 27 June 2025 |
27.94 (1.56%) |
26.07 |
25.20 - 28.34 |
2.0673 times |

Monthly price and charts PcsTech Strong monthly Stock price targets for PcsTech 517119 are 22.58 and 27.37 | Monthly Target 1 | 21.52 | | Monthly Target 2 | 23.64 | | Monthly Target 3 | 26.313333333333 | | Monthly Target 4 | 28.43 | | Monthly Target 5 | 31.1 |
Monthly price and volumes Pcs Tech
| Date |
Closing |
Open |
Range |
Volume |
Tue 02 September 2025 |
25.75 (3.54%) |
28.99 |
24.20 - 28.99 |
0.2071 times |
Fri 29 August 2025 |
24.87 (-3.98%) |
29.00 |
23.58 - 29.00 |
0.5885 times |
Thu 31 July 2025 |
25.90 (-6.23%) |
27.99 |
25.00 - 30.98 |
0.6953 times |
Mon 30 June 2025 |
27.62 (7.55%) |
26.65 |
24.56 - 28.39 |
1.0958 times |
Fri 30 May 2025 |
25.68 (-1.38%) |
26.55 |
24.00 - 28.09 |
1.0959 times |
Wed 30 April 2025 |
26.04 (-7%) |
29.38 |
25.11 - 31.39 |
0.5858 times |
Fri 28 March 2025 |
28.00 (-2.64%) |
29.48 |
27.10 - 32.49 |
0.5548 times |
Fri 28 February 2025 |
28.76 (-5.39%) |
31.46 |
28.60 - 35.72 |
0.5849 times |
Fri 31 January 2025 |
30.40 (-10.01%) |
34.46 |
28.95 - 37.49 |
1.0314 times |
Tue 31 December 2024 |
33.78 (13.43%) |
29.80 |
29.34 - 44.88 |
3.5606 times |
Fri 29 November 2024 |
29.78 (-10.14%) |
33.80 |
27.36 - 34.65 |
1.0372 times |

DMA SMA EMA moving averages of Pcs Tech 517119
DMA (daily moving average) of Pcs Tech 517119
| DMA period | DMA value | | 5 day DMA | 25.29 | | 12 day DMA | 25.45 | | 20 day DMA | 25.33 | | 35 day DMA | 25.93 | | 50 day DMA | 26.31 | | 100 day DMA | 26.6 | | 150 day DMA | 28.06 | | 200 day DMA | 29.4 | EMA (exponential moving average) of Pcs Tech 517119
| EMA period | EMA current | EMA prev | EMA prev2 | | 5 day EMA | 25.49 | 25.36 | 25.17 | | 12 day EMA | 25.45 | 25.39 | 25.33 | | 20 day EMA | 25.55 | 25.53 | 25.51 | | 35 day EMA | 25.86 | 25.87 | 25.88 | | 50 day EMA | 26.28 | 26.3 | 26.32 |
SMA (simple moving average) of Pcs Tech 517119
| SMA period | SMA current | SMA prev | SMA prev2 | | 5 day SMA | 25.29 | 25.25 | 25.27 | | 12 day SMA | 25.45 | 25.35 | 25.21 | | 20 day SMA | 25.33 | 25.33 | 25.34 | | 35 day SMA | 25.93 | 25.97 | 26.01 | | 50 day SMA | 26.31 | 26.34 | 26.37 | | 100 day SMA | 26.6 | 26.63 | 26.65 | | 150 day SMA | 28.06 | 28.09 | 28.11 | | 200 day SMA | 29.4 | 29.44 | 29.48 |
|
|
