Aplab 517096 full analysis,charts,indicators,moving averages,SMA,DMA,EMA,ADX,MACD,RSIAplab 517096 WideScreen charts, DMA,SMA,EMA technical analysis, forecast prediction, by indicators ADX,MACD,RSI,CCI BSE stock exchange
Daily price and charts and targets Aplab Strong Daily Stock price targets for Aplab 517096 are 82.97 and 82.97 | Daily Target 1 | 82.97 | | Daily Target 2 | 82.97 | | Daily Target 3 | 82.97 | | Daily Target 4 | 82.97 | | Daily Target 5 | 82.97 |
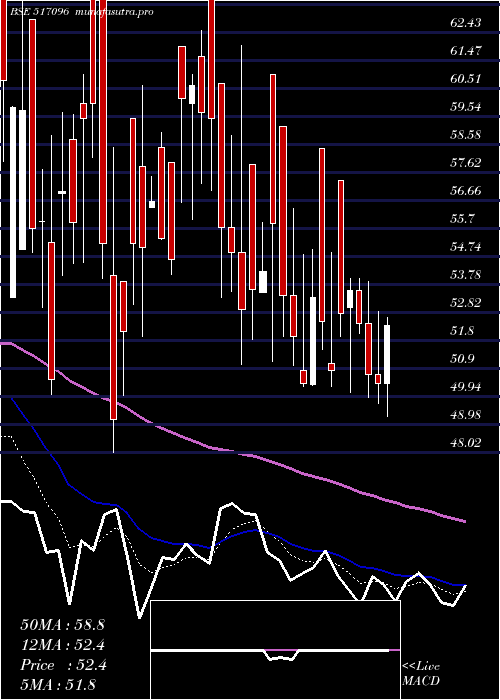
Daily price and volume Aplab
| Date |
Closing |
Open |
Range |
Volume |
Tue 21 October 2025 |
82.97 (5%) |
82.97 |
82.97 - 82.97 |
0.6632 times |
Mon 20 October 2025 |
79.02 (5%) |
76.20 |
74.99 - 79.02 |
2.5047 times |
Fri 17 October 2025 |
75.26 (3.58%) |
74.11 |
71.00 - 75.97 |
1.319 times |
Thu 16 October 2025 |
72.66 (5%) |
68.10 |
67.30 - 72.66 |
1.4415 times |
Wed 15 October 2025 |
69.20 (-2.27%) |
70.00 |
67.27 - 70.00 |
0.4765 times |
Tue 14 October 2025 |
70.81 (-4.99%) |
72.47 |
70.81 - 76.63 |
0.4476 times |
Mon 13 October 2025 |
74.53 (3.8%) |
71.80 |
68.21 - 75.39 |
1.0524 times |
Fri 10 October 2025 |
71.80 (-1.99%) |
71.80 |
71.80 - 71.80 |
0.2372 times |
Thu 09 October 2025 |
73.26 (-1.99%) |
74.75 |
73.26 - 74.75 |
0.8253 times |
Wed 08 October 2025 |
74.75 (-1.98%) |
74.75 |
74.75 - 76.26 |
1.0326 times |
Tue 07 October 2025 |
76.26 (-1.99%) |
76.26 |
76.26 - 76.26 |
0.1209 times |
Weekly price and charts Aplab Strong weekly Stock price targets for Aplab 517096 are 78.98 and 86.96 | Weekly Target 1 | 72.33 | | Weekly Target 2 | 77.65 | | Weekly Target 3 | 80.31 | | Weekly Target 4 | 85.63 | | Weekly Target 5 | 88.29 |
Weekly price and volumes for Aplab
| Date |
Closing |
Open |
Range |
Volume |
Tue 21 October 2025 |
82.97 (10.24%) |
76.20 |
74.99 - 82.97 |
0.8932 times |
Fri 17 October 2025 |
75.26 (4.82%) |
71.80 |
67.27 - 76.63 |
1.3356 times |
Fri 10 October 2025 |
71.80 (-5.89%) |
77.81 |
71.80 - 77.81 |
1.0696 times |
Fri 03 October 2025 |
76.29 (-7.74%) |
81.04 |
76.29 - 81.04 |
0.7788 times |
Fri 26 September 2025 |
82.69 (6.07%) |
79.51 |
79.51 - 84.37 |
0.9577 times |
Fri 19 September 2025 |
77.96 (10.36%) |
72.05 |
72.05 - 77.96 |
0.3765 times |
Fri 12 September 2025 |
70.64 (10.38%) |
65.28 |
65.28 - 70.64 |
1.0511 times |
Fri 05 September 2025 |
64.00 (10.34%) |
56.84 |
56.84 - 64.02 |
1.1348 times |
Fri 29 August 2025 |
58.00 (4.28%) |
56.73 |
56.73 - 59.99 |
1.1717 times |
Fri 22 August 2025 |
55.62 (20.39%) |
48.51 |
48.51 - 55.62 |
1.2311 times |
Thu 14 August 2025 |
46.20 (5.19%) |
41.73 |
41.73 - 46.20 |
0.4598 times |

Monthly price and charts Aplab Strong monthly Stock price targets for Aplab 517096 are 75.12 and 90.82 | Monthly Target 1 | 62.04 | | Monthly Target 2 | 72.5 | | Monthly Target 3 | 77.736666666667 | | Monthly Target 4 | 88.2 | | Monthly Target 5 | 93.44 |
Monthly price and volumes Aplab
| Date |
Closing |
Open |
Range |
Volume |
Tue 21 October 2025 |
82.97 (4.47%) |
77.84 |
67.27 - 82.97 |
0.686 times |
Tue 30 September 2025 |
79.42 (36.93%) |
56.84 |
56.84 - 84.37 |
0.6856 times |
Fri 29 August 2025 |
58.00 (31.22%) |
43.33 |
41.73 - 59.99 |
0.5607 times |
Thu 31 July 2025 |
44.20 (-7.86%) |
47.02 |
44.20 - 49.94 |
0.6498 times |
Mon 30 June 2025 |
47.97 (-11.13%) |
53.89 |
37.71 - 53.90 |
2.5991 times |
Fri 30 May 2025 |
53.98 (0.2%) |
50.00 |
48.32 - 86.69 |
2.679 times |
Wed 30 April 2025 |
53.87 (6.91%) |
50.35 |
49.25 - 58.45 |
0.185 times |
Fri 28 March 2025 |
50.39 (-3.43%) |
59.49 |
50.30 - 63.68 |
0.7669 times |
Fri 28 February 2025 |
52.18 (-28.04%) |
71.12 |
48.02 - 77.95 |
0.8616 times |
Fri 31 January 2025 |
72.51 (-12.59%) |
81.00 |
71.03 - 85.75 |
0.3263 times |
Tue 31 December 2024 |
82.95 (6.35%) |
78.00 |
75.25 - 94.98 |
0.976 times |

DMA SMA EMA moving averages of Aplab 517096
DMA (daily moving average) of Aplab 517096
| DMA period | DMA value | | 5 day DMA | 75.82 | | 12 day DMA | 74.86 | | 20 day DMA | 77.19 | | 35 day DMA | 73.9 | | 50 day DMA | 67.23 | | 100 day DMA | 56.84 | | 150 day DMA | 56.95 | | 200 day DMA | 60.45 | EMA (exponential moving average) of Aplab 517096
| EMA period | EMA current | EMA prev | EMA prev2 | | 5 day EMA | 77.74 | 75.12 | 73.17 | | 12 day EMA | 76.05 | 74.79 | 74.02 | | 20 day EMA | 75.02 | 74.18 | 73.67 | | 35 day EMA | 70.73 | 70.01 | 69.48 | | 50 day EMA | 66.28 | 65.6 | 65.05 |
SMA (simple moving average) of Aplab 517096
| SMA period | SMA current | SMA prev | SMA prev2 | | 5 day SMA | 75.82 | 73.39 | 72.49 | | 12 day SMA | 74.86 | 74.3 | 74.21 | | 20 day SMA | 77.19 | 77.02 | 76.96 | | 35 day SMA | 73.9 | 73.22 | 72.62 | | 50 day SMA | 67.23 | 66.47 | 65.8 | | 100 day SMA | 56.84 | 56.84 | 56.84 | | 150 day SMA | 56.95 | 56.77 | 56.61 | | 200 day SMA | 60.45 | 60.44 | 60.46 |
|
|
