IntData 517044 full analysis,charts,indicators,moving averages,SMA,DMA,EMA,ADX,MACD,RSIInt Data 517044 WideScreen charts, DMA,SMA,EMA technical analysis, forecast prediction, by indicators ADX,MACD,RSI,CCI BSE stock exchange
Daily price and charts and targets IntData Strong Daily Stock price targets for IntData 517044 are 24.17 and 24.17 | Daily Target 1 | 24.17 | | Daily Target 2 | 24.17 | | Daily Target 3 | 24.17 | | Daily Target 4 | 24.17 | | Daily Target 5 | 24.17 |
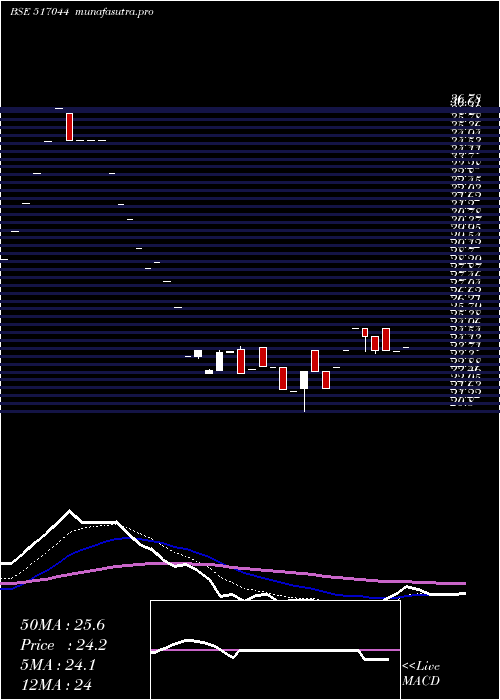
Daily price and volume Int Data
| Date |
Closing |
Open |
Range |
Volume |
Fri 23 May 2025 |
24.17 (0.96%) |
24.17 |
24.17 - 24.17 |
0.0144 times |
Thu 22 May 2025 |
23.94 (-0.25%) |
23.94 |
23.94 - 23.94 |
0.1198 times |
Tue 20 May 2025 |
24.00 (0%) |
25.20 |
24.00 - 25.20 |
3.5954 times |
Mon 19 May 2025 |
24.00 (-3.15%) |
24.78 |
23.84 - 24.78 |
3.8878 times |
Fri 16 May 2025 |
24.78 (-1.67%) |
25.20 |
23.95 - 25.20 |
0.0144 times |
Thu 15 May 2025 |
25.20 (5%) |
25.20 |
25.20 - 25.20 |
0.2589 times |
Wed 14 May 2025 |
24.00 (3.9%) |
24.00 |
24.00 - 24.00 |
0.1246 times |
Mon 12 May 2025 |
23.10 (5%) |
23.10 |
23.10 - 23.10 |
0.1438 times |
Wed 07 May 2025 |
22.00 (-3.93%) |
22.90 |
22.00 - 22.90 |
0.9588 times |
Tue 06 May 2025 |
22.90 (0%) |
24.04 |
22.90 - 24.04 |
0.8821 times |
Mon 05 May 2025 |
22.90 (4.81%) |
22.01 |
20.80 - 22.90 |
1.1985 times |
Weekly price and charts IntData Strong weekly Stock price targets for IntData 517044 are 23.33 and 24.69 | Weekly Target 1 | 23.04 | | Weekly Target 2 | 23.61 | | Weekly Target 3 | 24.403333333333 | | Weekly Target 4 | 24.97 | | Weekly Target 5 | 25.76 |
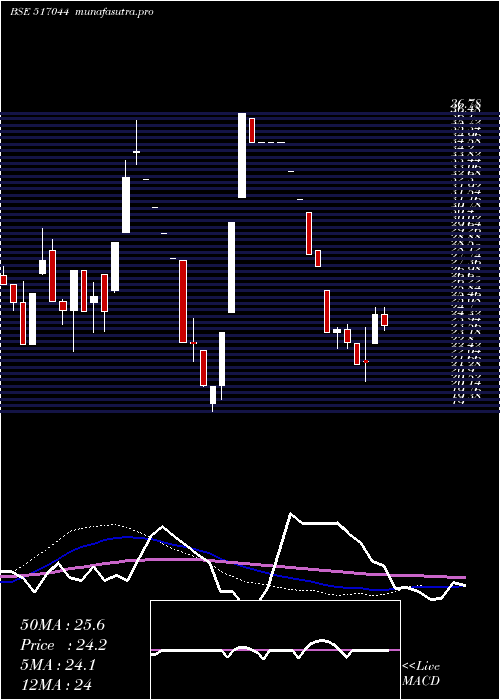
Weekly price and volumes for Int Data
| Date |
Closing |
Open |
Range |
Volume |
Fri 23 May 2025 |
24.17 (-2.46%) |
24.78 |
23.84 - 25.20 |
1.8541 times |
Fri 16 May 2025 |
24.78 (12.64%) |
23.10 |
23.10 - 25.20 |
0.1319 times |
Wed 07 May 2025 |
22.00 (0.69%) |
22.01 |
20.80 - 24.04 |
0.7398 times |
Fri 02 May 2025 |
21.85 (-5.62%) |
23.10 |
21.85 - 23.10 |
0.2637 times |
Fri 25 April 2025 |
23.15 (-3.14%) |
23.90 |
22.80 - 24.21 |
1.1179 times |
Thu 17 April 2025 |
23.90 (0.8%) |
23.71 |
22.80 - 24.00 |
5.2975 times |
Fri 11 April 2025 |
23.71 (-14.22%) |
26.26 |
23.71 - 26.26 |
0.154 times |
Wed 26 March 2025 |
27.64 (-2.54%) |
28.64 |
27.64 - 28.64 |
0.3956 times |
Fri 21 March 2025 |
28.36 (-10.51%) |
30.90 |
28.36 - 30.90 |
0.0408 times |
Mon 03 March 2025 |
31.69 (-4.98%) |
31.69 |
31.69 - 31.69 |
0.0047 times |
Mon 17 February 2025 |
33.35 (-4.99%) |
33.35 |
33.35 - 33.35 |
0.0047 times |
Monthly price and charts IntData Strong monthly Stock price targets for IntData 517044 are 22.49 and 26.89 | Monthly Target 1 | 18.99 | | Monthly Target 2 | 21.58 | | Monthly Target 3 | 23.39 | | Monthly Target 4 | 25.98 | | Monthly Target 5 | 27.79 |
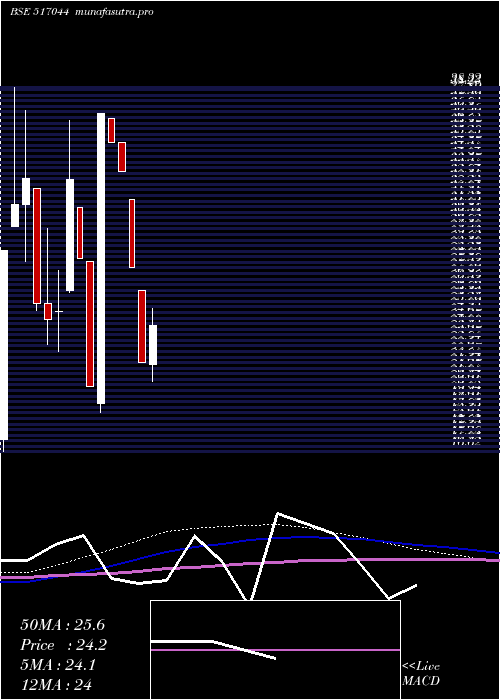
Monthly price and volumes Int Data
| Date |
Closing |
Open |
Range |
Volume |
Fri 23 May 2025 |
24.17 (10.11%) |
21.85 |
20.80 - 25.20 |
0.3742 times |
Wed 30 April 2025 |
21.95 (-20.59%) |
26.26 |
21.95 - 26.26 |
0.8841 times |
Wed 26 March 2025 |
27.64 (-17.12%) |
31.69 |
27.64 - 31.69 |
0.0581 times |
Mon 17 February 2025 |
33.35 (-4.99%) |
35.10 |
33.35 - 35.10 |
0.4617 times |
Mon 27 January 2025 |
35.10 (-4.57%) |
36.50 |
35.10 - 36.50 |
0.225 times |
Fri 27 December 2024 |
36.78 (79.07%) |
19.52 |
19.00 - 36.78 |
2.1759 times |
Fri 29 November 2024 |
20.54 (-27.06%) |
28.00 |
20.53 - 28.00 |
1.0535 times |
Mon 28 October 2024 |
28.16 (-14.25%) |
31.20 |
28.16 - 31.20 |
0.0089 times |
Mon 30 September 2024 |
32.84 (31.36%) |
26.25 |
26.10 - 36.38 |
1.7054 times |
Fri 30 August 2024 |
25.00 (2.04%) |
25.00 |
22.61 - 27.44 |
3.0532 times |
Wed 31 July 2024 |
24.50 (-3.92%) |
25.50 |
23.02 - 29.95 |
1.0079 times |
DMA SMA EMA moving averages of Int Data 517044
DMA (daily moving average) of Int Data 517044
| DMA period | DMA value | | 5 day DMA | 24.18 | | 12 day DMA | 23.57 | | 20 day DMA | 23.38 | | 35 day DMA | 26.54 | | 50 day DMA | 26.32 | | 100 day DMA | 26.6 | | 150 day DMA | 27.27 | | 200 day DMA | 27.51 | EMA (exponential moving average) of Int Data 517044
| EMA period | EMA current | EMA prev | EMA prev2 | | 5 day EMA | 24.07 | 24.02 | 24.06 | | 12 day EMA | 23.95 | 23.91 | 23.91 | | 20 day EMA | 24.25 | 24.26 | 24.29 | | 35 day EMA | 24.76 | 24.8 | 24.85 | | 50 day EMA | 25.77 | 25.84 | 25.92 |
SMA (simple moving average) of Int Data 517044
| SMA period | SMA current | SMA prev | SMA prev2 | | 5 day SMA | 24.18 | 24.38 | 24.4 | | 12 day SMA | 23.57 | 23.39 | 23.32 | | 20 day SMA | 23.38 | 23.38 | 23.36 | | 35 day SMA | 26.54 | 26.85 | 27.12 | | 50 day SMA | 26.32 | 26.26 | 26.24 | | 100 day SMA | 26.6 | 26.62 | 26.63 | | 150 day SMA | 27.27 | 27.33 | 27.39 | | 200 day SMA | 27.51 | 27.47 | 27.44 |
|
|
