VindhyaTele 517015 full analysis,charts,indicators,moving averages,SMA,DMA,EMA,ADX,MACD,RSIVindhya Tele 517015 WideScreen charts, DMA,SMA,EMA technical analysis, forecast prediction, by indicators ADX,MACD,RSI,CCI BSE stock exchange
Daily price and charts and targets VindhyaTele Strong Daily Stock price targets for VindhyaTele 517015 are 1422.33 and 1436.33 | Daily Target 1 | 1411.55 | | Daily Target 2 | 1419.1 | | Daily Target 3 | 1425.55 | | Daily Target 4 | 1433.1 | | Daily Target 5 | 1439.55 |
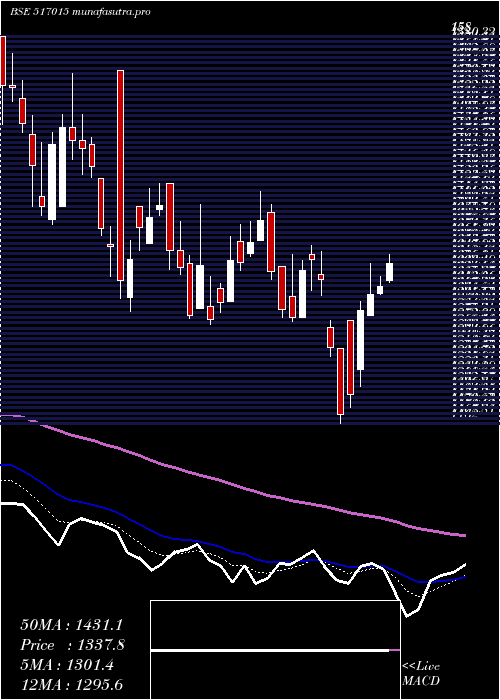
Daily price and volume Vindhya Tele
| Date |
Closing |
Open |
Range |
Volume |
Tue 21 October 2025 |
1426.65 (0.52%) |
1420.90 |
1418.00 - 1432.00 |
0.4682 times |
Mon 20 October 2025 |
1419.25 (0.16%) |
1448.00 |
1400.05 - 1448.00 |
1.043 times |
Fri 17 October 2025 |
1417.05 (0.06%) |
1410.10 |
1408.80 - 1440.00 |
1.8898 times |
Thu 16 October 2025 |
1416.15 (2.73%) |
1385.20 |
1385.20 - 1436.70 |
1.074 times |
Wed 15 October 2025 |
1378.45 (0.9%) |
1366.15 |
1364.10 - 1383.50 |
0.599 times |
Tue 14 October 2025 |
1366.15 (-1.04%) |
1379.30 |
1359.00 - 1379.30 |
0.1652 times |
Mon 13 October 2025 |
1380.45 (-0.26%) |
1375.00 |
1375.00 - 1386.75 |
0.895 times |
Fri 10 October 2025 |
1384.00 (-0.01%) |
1391.00 |
1377.30 - 1400.05 |
1.3494 times |
Thu 09 October 2025 |
1384.10 (1.15%) |
1375.20 |
1373.45 - 1396.20 |
1.2909 times |
Wed 08 October 2025 |
1368.40 (-0.39%) |
1350.55 |
1350.55 - 1396.95 |
1.2255 times |
Tue 07 October 2025 |
1373.75 (-1.68%) |
1375.65 |
1368.90 - 1399.95 |
3.3838 times |
Weekly price and charts VindhyaTele Strong weekly Stock price targets for VindhyaTele 517015 are 1389.38 and 1437.33 | Weekly Target 1 | 1376.95 | | Weekly Target 2 | 1401.8 | | Weekly Target 3 | 1424.9 | | Weekly Target 4 | 1449.75 | | Weekly Target 5 | 1472.85 |
Weekly price and volumes for Vindhya Tele
| Date |
Closing |
Open |
Range |
Volume |
Tue 21 October 2025 |
1426.65 (0.68%) |
1448.00 |
1400.05 - 1448.00 |
0.1747 times |
Fri 17 October 2025 |
1417.05 (2.39%) |
1375.00 |
1359.00 - 1440.00 |
0.5346 times |
Fri 10 October 2025 |
1384.00 (-3.85%) |
1385.65 |
1350.55 - 1446.50 |
1.2101 times |
Fri 03 October 2025 |
1439.45 (0.83%) |
1420.00 |
1381.00 - 1452.05 |
1.3526 times |
Fri 26 September 2025 |
1427.55 (-5.95%) |
1511.00 |
1420.00 - 1511.00 |
1.3777 times |
Fri 19 September 2025 |
1517.85 (2.03%) |
1472.50 |
1440.00 - 1530.00 |
1.7343 times |
Fri 12 September 2025 |
1487.70 (-0.9%) |
1510.50 |
1468.90 - 1535.10 |
0.658 times |
Fri 05 September 2025 |
1501.15 (1.65%) |
1480.20 |
1476.00 - 1540.30 |
0.5477 times |
Fri 29 August 2025 |
1476.75 (-2.82%) |
1515.05 |
1454.40 - 1532.80 |
1.2208 times |
Fri 22 August 2025 |
1519.60 (2.02%) |
1527.75 |
1490.65 - 1581.00 |
1.1894 times |
Thu 14 August 2025 |
1489.45 (-0.46%) |
1482.15 |
1482.15 - 1604.00 |
1.8335 times |

Monthly price and charts VindhyaTele Strong monthly Stock price targets for VindhyaTele 517015 are 1388.6 and 1490.1 | Monthly Target 1 | 1308.25 | | Monthly Target 2 | 1367.45 | | Monthly Target 3 | 1409.75 | | Monthly Target 4 | 1468.95 | | Monthly Target 5 | 1511.25 |
Monthly price and volumes Vindhya Tele
| Date |
Closing |
Open |
Range |
Volume |
Tue 21 October 2025 |
1426.65 (2.78%) |
1388.00 |
1350.55 - 1452.05 |
0.19 times |
Tue 30 September 2025 |
1388.00 (-6.01%) |
1480.20 |
1381.00 - 1540.30 |
0.3224 times |
Fri 29 August 2025 |
1476.75 (-6.6%) |
1603.10 |
1454.40 - 1604.00 |
0.3454 times |
Thu 31 July 2025 |
1581.15 (-7.49%) |
1729.00 |
1495.30 - 1766.90 |
0.5798 times |
Mon 30 June 2025 |
1709.20 (1.87%) |
1669.65 |
1650.80 - 1889.95 |
0.6761 times |
Fri 30 May 2025 |
1677.90 (27.4%) |
1320.10 |
1250.05 - 1708.90 |
1.5214 times |
Wed 30 April 2025 |
1317.00 (3.06%) |
1278.00 |
1162.00 - 1452.35 |
1.2468 times |
Fri 28 March 2025 |
1277.90 (-5.74%) |
1548.85 |
1270.10 - 1548.85 |
2.7628 times |
Fri 28 February 2025 |
1355.75 (-19.28%) |
1640.25 |
1323.35 - 1721.55 |
1.3309 times |
Fri 31 January 2025 |
1679.55 (-10.98%) |
1886.80 |
1600.00 - 1948.20 |
1.0245 times |
Tue 31 December 2024 |
1886.80 (-4.31%) |
1952.05 |
1826.00 - 2280.95 |
0.812 times |

DMA SMA EMA moving averages of Vindhya Tele 517015
DMA (daily moving average) of Vindhya Tele 517015
| DMA period | DMA value | | 5 day DMA | 1411.51 | | 12 day DMA | 1392.64 | | 20 day DMA | 1409.88 | | 35 day DMA | 1449.17 | | 50 day DMA | 1468.99 | | 100 day DMA | 1572.2 | | 150 day DMA | 1508.45 | | 200 day DMA | 1550.87 | EMA (exponential moving average) of Vindhya Tele 517015
| EMA period | EMA current | EMA prev | EMA prev2 | | 5 day EMA | 1413.06 | 1406.26 | 1399.76 | | 12 day EMA | 1408.01 | 1404.62 | 1401.96 | | 20 day EMA | 1418.02 | 1417.11 | 1416.88 | | 35 day EMA | 1440.04 | 1440.83 | 1442.1 | | 50 day EMA | 1469.51 | 1471.26 | 1473.38 |
SMA (simple moving average) of Vindhya Tele 517015
| SMA period | SMA current | SMA prev | SMA prev2 | | 5 day SMA | 1411.51 | 1399.41 | 1391.65 | | 12 day SMA | 1392.64 | 1393.7 | 1393.45 | | 20 day SMA | 1409.88 | 1413.33 | 1418.26 | | 35 day SMA | 1449.17 | 1451.07 | 1452.71 | | 50 day SMA | 1468.99 | 1471.07 | 1473.12 | | 100 day SMA | 1572.2 | 1574.47 | 1576.64 | | 150 day SMA | 1508.45 | 1508.12 | 1507.6 | | 200 day SMA | 1550.87 | 1553.31 | 1555.89 |
|
|
