Scandent 516110 full analysis,charts,indicators,moving averages,SMA,DMA,EMA,ADX,MACD,RSIScandent 516110 WideScreen charts, DMA,SMA,EMA technical analysis, forecast prediction, by indicators ADX,MACD,RSI,CCI BSE stock exchange
Daily price and charts and targets Scandent Strong Daily Stock price targets for Scandent 516110 are 4.34 and 4.39 | Daily Target 1 | 4.33 | | Daily Target 2 | 4.35 | | Daily Target 3 | 4.3766666666667 | | Daily Target 4 | 4.4 | | Daily Target 5 | 4.43 |
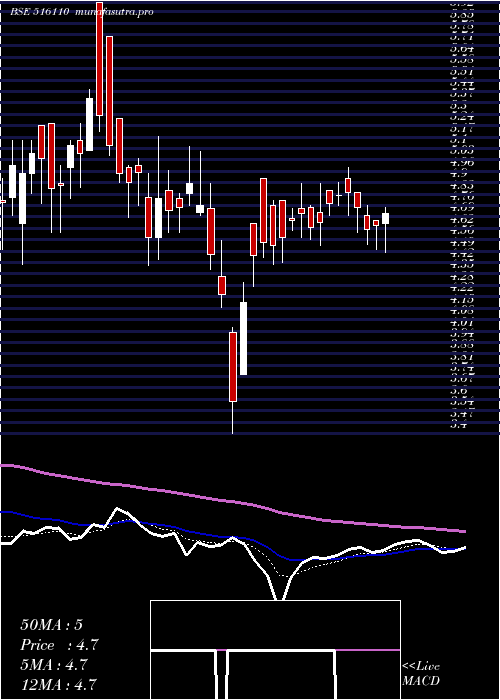
Daily price and volume Scandent
| Date |
Closing |
Open |
Range |
Volume |
Thu 23 October 2025 |
4.38 (0.92%) |
4.40 |
4.35 - 4.40 |
0.8483 times |
Tue 21 October 2025 |
4.34 (-2.03%) |
4.45 |
4.31 - 4.50 |
0.7832 times |
Mon 20 October 2025 |
4.43 (2.55%) |
4.36 |
4.23 - 4.53 |
0.9722 times |
Fri 17 October 2025 |
4.32 (-1.82%) |
4.40 |
4.30 - 4.46 |
0.7142 times |
Thu 16 October 2025 |
4.40 (-3.93%) |
4.51 |
4.36 - 4.58 |
1.5344 times |
Wed 15 October 2025 |
4.58 (-2.14%) |
4.63 |
4.52 - 4.70 |
1.1248 times |
Tue 14 October 2025 |
4.68 (1.08%) |
4.63 |
4.58 - 4.84 |
1.3608 times |
Mon 13 October 2025 |
4.63 (-1.28%) |
4.62 |
4.62 - 4.73 |
1.2911 times |
Fri 10 October 2025 |
4.69 (0.21%) |
4.77 |
4.65 - 4.80 |
0.8541 times |
Thu 09 October 2025 |
4.68 (-3.11%) |
4.90 |
4.66 - 4.90 |
0.5169 times |
Wed 08 October 2025 |
4.83 (2.77%) |
4.85 |
4.68 - 4.85 |
0.9375 times |
Weekly price and charts Scandent Strong weekly Stock price targets for Scandent 516110 are 4.31 and 4.61 | Weekly Target 1 | 4.08 | | Weekly Target 2 | 4.23 | | Weekly Target 3 | 4.38 | | Weekly Target 4 | 4.53 | | Weekly Target 5 | 4.68 |
Weekly price and volumes for Scandent
| Date |
Closing |
Open |
Range |
Volume |
Thu 23 October 2025 |
4.38 (1.39%) |
4.36 |
4.23 - 4.53 |
0.2238 times |
Fri 17 October 2025 |
4.32 (-7.89%) |
4.62 |
4.30 - 4.84 |
0.5178 times |
Fri 10 October 2025 |
4.69 (3.53%) |
4.43 |
4.43 - 4.90 |
0.507 times |
Fri 03 October 2025 |
4.53 (-10.83%) |
4.98 |
4.33 - 4.98 |
2.0297 times |
Fri 26 September 2025 |
5.08 (3.89%) |
5.20 |
5.00 - 5.83 |
2.1341 times |
Fri 19 September 2025 |
4.89 (11.64%) |
4.35 |
4.16 - 4.96 |
2.3941 times |
Fri 12 September 2025 |
4.38 (2.34%) |
4.37 |
4.34 - 4.70 |
0.5163 times |
Fri 05 September 2025 |
4.28 (-0.47%) |
4.37 |
4.16 - 4.52 |
0.6141 times |
Fri 29 August 2025 |
4.30 (-1.15%) |
4.41 |
4.03 - 4.69 |
0.5402 times |
Fri 22 August 2025 |
4.35 (-1.58%) |
4.40 |
4.15 - 4.44 |
0.5229 times |
Thu 14 August 2025 |
4.42 (15.4%) |
3.83 |
3.81 - 4.44 |
0.8139 times |

Monthly price and charts Scandent Strong monthly Stock price targets for Scandent 516110 are 3.97 and 4.64 | Monthly Target 1 | 3.83 | | Monthly Target 2 | 4.11 | | Monthly Target 3 | 4.5033333333333 | | Monthly Target 4 | 4.78 | | Monthly Target 5 | 5.17 |
Monthly price and volumes Scandent
| Date |
Closing |
Open |
Range |
Volume |
Thu 23 October 2025 |
4.38 (-5.6%) |
4.60 |
4.23 - 4.90 |
0.7821 times |
Tue 30 September 2025 |
4.64 (7.91%) |
4.37 |
4.16 - 5.83 |
1.7031 times |
Fri 29 August 2025 |
4.30 (-1.83%) |
4.40 |
3.68 - 4.69 |
0.8969 times |
Thu 31 July 2025 |
4.38 (-2.45%) |
4.54 |
4.10 - 4.55 |
0.6624 times |
Mon 30 June 2025 |
4.49 (-0.66%) |
4.52 |
4.21 - 4.60 |
0.636 times |
Fri 30 May 2025 |
4.52 (-4.03%) |
4.71 |
3.98 - 4.98 |
0.6687 times |
Wed 30 April 2025 |
4.71 (31.2%) |
3.75 |
3.75 - 4.99 |
0.7059 times |
Fri 28 March 2025 |
3.59 (-26.13%) |
4.89 |
3.40 - 5.97 |
1.7428 times |
Fri 28 February 2025 |
4.86 (-24.77%) |
6.39 |
4.32 - 6.42 |
1.1793 times |
Fri 31 January 2025 |
6.46 (-3%) |
6.55 |
5.83 - 7.29 |
1.0229 times |
Tue 31 December 2024 |
6.66 (-2.49%) |
6.72 |
6.40 - 7.60 |
1.2746 times |

DMA SMA EMA moving averages of Scandent 516110
DMA (daily moving average) of Scandent 516110
| DMA period | DMA value | | 5 day DMA | 4.37 | | 12 day DMA | 4.56 | | 20 day DMA | 4.7 | | 35 day DMA | 4.63 | | 50 day DMA | 4.54 | | 100 day DMA | 4.46 | | 150 day DMA | 4.51 | | 200 day DMA | 4.88 | EMA (exponential moving average) of Scandent 516110
| EMA period | EMA current | EMA prev | EMA prev2 | | 5 day EMA | 4.41 | 4.43 | 4.47 | | 12 day EMA | 4.51 | 4.53 | 4.57 | | 20 day EMA | 4.58 | 4.6 | 4.63 | | 35 day EMA | 4.55 | 4.56 | 4.57 | | 50 day EMA | 4.5 | 4.5 | 4.51 |
SMA (simple moving average) of Scandent 516110
| SMA period | SMA current | SMA prev | SMA prev2 | | 5 day SMA | 4.37 | 4.41 | 4.48 | | 12 day SMA | 4.56 | 4.58 | 4.6 | | 20 day SMA | 4.7 | 4.76 | 4.8 | | 35 day SMA | 4.63 | 4.63 | 4.63 | | 50 day SMA | 4.54 | 4.52 | 4.52 | | 100 day SMA | 4.46 | 4.46 | 4.46 | | 150 day SMA | 4.51 | 4.52 | 4.52 | | 200 day SMA | 4.88 | 4.89 | 4.9 |
|
|
