Anantraj 515055 full analysis,charts,indicators,moving averages,SMA,DMA,EMA,ADX,MACD,RSIAnantraj 515055 WideScreen charts, DMA,SMA,EMA technical analysis, forecast prediction, by indicators ADX,MACD,RSI,CCI BSE stock exchange
Daily price and charts and targets Anantraj Strong Daily Stock price targets for Anantraj 515055 are 614.88 and 638.88 | Daily Target 1 | 610.58 | | Daily Target 2 | 619.17 | | Daily Target 3 | 634.58333333333 | | Daily Target 4 | 643.17 | | Daily Target 5 | 658.58 |
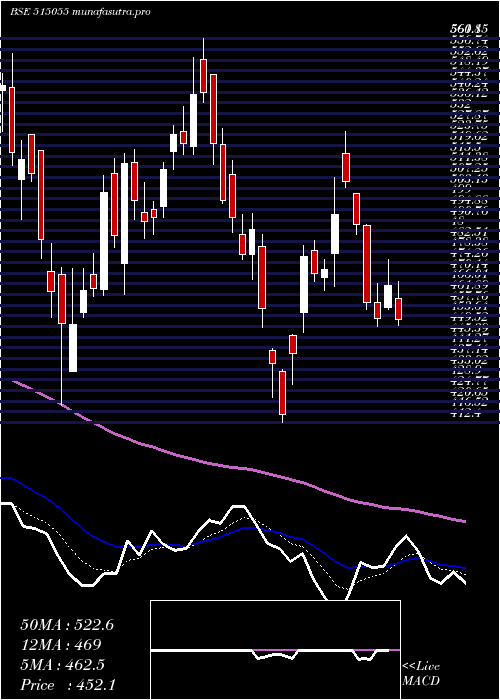
Daily price and volume Anantraj
| Date |
Closing |
Open |
Range |
Volume |
Thu 23 October 2025 |
627.75 (-2.55%) |
645.55 |
626.00 - 650.00 |
1.0008 times |
Tue 21 October 2025 |
644.20 (1.31%) |
644.30 |
640.00 - 645.90 |
0.1685 times |
Mon 20 October 2025 |
635.90 (2.35%) |
624.30 |
618.90 - 638.60 |
0.7379 times |
Fri 17 October 2025 |
621.30 (-1.89%) |
635.00 |
619.00 - 642.10 |
0.8461 times |
Thu 16 October 2025 |
633.30 (-4.42%) |
663.00 |
630.10 - 667.00 |
1.486 times |
Wed 15 October 2025 |
662.60 (0.74%) |
658.10 |
658.10 - 680.20 |
1.0728 times |
Tue 14 October 2025 |
657.75 (-4.06%) |
688.25 |
654.00 - 689.90 |
1.1995 times |
Mon 13 October 2025 |
685.60 (-1.53%) |
691.35 |
680.05 - 700.00 |
1.3487 times |
Fri 10 October 2025 |
696.25 (-0.4%) |
700.00 |
687.10 - 704.00 |
0.9484 times |
Thu 09 October 2025 |
699.05 (-0.09%) |
701.90 |
686.05 - 712.95 |
1.1914 times |
Wed 08 October 2025 |
699.70 (-4.97%) |
721.95 |
695.65 - 721.95 |
1.9569 times |
Weekly price and charts Anantraj Strong weekly Stock price targets for Anantraj 515055 are 623.33 and 654.43 | Weekly Target 1 | 601.12 | | Weekly Target 2 | 614.43 | | Weekly Target 3 | 632.21666666667 | | Weekly Target 4 | 645.53 | | Weekly Target 5 | 663.32 |
Weekly price and volumes for Anantraj
| Date |
Closing |
Open |
Range |
Volume |
Thu 23 October 2025 |
627.75 (1.04%) |
624.30 |
618.90 - 650.00 |
0.3629 times |
Fri 17 October 2025 |
621.30 (-10.76%) |
691.35 |
619.00 - 700.00 |
1.1328 times |
Fri 10 October 2025 |
696.25 (-3.33%) |
720.25 |
686.05 - 744.10 |
1.5411 times |
Fri 03 October 2025 |
720.20 (6.08%) |
698.85 |
684.30 - 731.55 |
0.9376 times |
Fri 26 September 2025 |
678.95 (6.06%) |
645.00 |
643.45 - 709.00 |
2.0167 times |
Fri 19 September 2025 |
640.15 (20.02%) |
537.00 |
537.00 - 647.00 |
3.3019 times |
Fri 12 September 2025 |
533.35 (-0.42%) |
544.85 |
517.00 - 544.85 |
0.1521 times |
Fri 05 September 2025 |
535.60 (3.72%) |
518.15 |
515.80 - 549.95 |
0.2532 times |
Fri 29 August 2025 |
516.40 (-5.59%) |
549.05 |
511.40 - 551.95 |
0.1356 times |
Fri 22 August 2025 |
547.00 (2.13%) |
548.35 |
537.60 - 560.00 |
0.1661 times |
Thu 14 August 2025 |
535.60 (0.24%) |
535.55 |
526.85 - 544.95 |
0.2165 times |

Monthly price and charts Anantraj Strong monthly Stock price targets for Anantraj 515055 are 560.73 and 685.93 | Monthly Target 1 | 538.38 | | Monthly Target 2 | 583.07 | | Monthly Target 3 | 663.58333333333 | | Monthly Target 4 | 708.27 | | Monthly Target 5 | 788.78 |
Monthly price and volumes Anantraj
| Date |
Closing |
Open |
Range |
Volume |
Thu 23 October 2025 |
627.75 (-10.09%) |
699.65 |
618.90 - 744.10 |
1.4526 times |
Tue 30 September 2025 |
698.20 (35.21%) |
518.15 |
515.80 - 719.80 |
2.6899 times |
Fri 29 August 2025 |
516.40 (-8.58%) |
562.05 |
511.40 - 573.55 |
0.3856 times |
Thu 31 July 2025 |
564.85 (-0.24%) |
570.50 |
534.00 - 619.80 |
1.1419 times |
Mon 30 June 2025 |
566.20 (0.83%) |
565.00 |
498.00 - 604.90 |
0.851 times |
Fri 30 May 2025 |
561.55 (24.21%) |
452.10 |
414.00 - 570.00 |
0.8867 times |
Wed 30 April 2025 |
452.10 (-8.08%) |
485.15 |
412.40 - 525.00 |
0.774 times |
Fri 28 March 2025 |
491.85 (6.17%) |
469.85 |
419.00 - 561.15 |
0.5881 times |
Fri 28 February 2025 |
463.25 (-22.55%) |
637.95 |
453.00 - 639.00 |
0.5569 times |
Fri 31 January 2025 |
598.10 (-30.02%) |
863.75 |
534.45 - 947.25 |
0.6733 times |
Tue 31 December 2024 |
854.65 (26.36%) |
676.40 |
674.55 - 874.30 |
0.3581 times |

DMA SMA EMA moving averages of Anantraj 515055
DMA (daily moving average) of Anantraj 515055
| DMA period | DMA value | | 5 day DMA | 632.49 | | 12 day DMA | 666.64 | | 20 day DMA | 677.75 | | 35 day DMA | 632.84 | | 50 day DMA | 603.74 | | 100 day DMA | 582.99 | | 150 day DMA | 550.52 | | 200 day DMA | 584.55 | EMA (exponential moving average) of Anantraj 515055
| EMA period | EMA current | EMA prev | EMA prev2 | | 5 day EMA | 638.79 | 644.31 | 644.36 | | 12 day EMA | 653.47 | 658.15 | 660.68 | | 20 day EMA | 652.86 | 655.5 | 656.69 | | 35 day EMA | 633.06 | 633.37 | 632.73 | | 50 day EMA | 602.16 | 601.12 | 599.36 |
SMA (simple moving average) of Anantraj 515055
| SMA period | SMA current | SMA prev | SMA prev2 | | 5 day SMA | 632.49 | 639.46 | 642.17 | | 12 day SMA | 666.64 | 673.08 | 679.42 | | 20 day SMA | 677.75 | 679.65 | 681.33 | | 35 day SMA | 632.84 | 630.29 | 626.78 | | 50 day SMA | 603.74 | 601.87 | 599.92 | | 100 day SMA | 582.99 | 582.16 | 580.89 | | 150 day SMA | 550.52 | 549.43 | 548.23 | | 200 day SMA | 584.55 | 585.52 | 586.44 |
|
|
