SanrheaTech 514280 full analysis,charts,indicators,moving averages,SMA,DMA,EMA,ADX,MACD,RSISanrhea Tech 514280 WideScreen charts, DMA,SMA,EMA technical analysis, forecast prediction, by indicators ADX,MACD,RSI,CCI BSE stock exchange
Daily price and charts and targets SanrheaTech Strong Daily Stock price targets for SanrheaTech 514280 are 108.68 and 137.93 | Daily Target 1 | 85.7 | | Daily Target 2 | 102.4 | | Daily Target 3 | 114.95 | | Daily Target 4 | 131.65 | | Daily Target 5 | 144.2 |
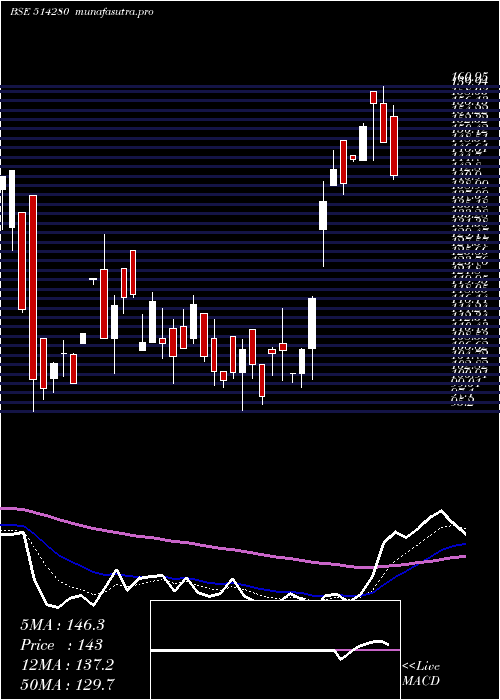
Daily price and volume Sanrhea Tech
| Date |
Closing |
Open |
Range |
Volume |
Fri 05 December 2025 |
119.10 (10.18%) |
107.60 |
98.25 - 127.50 |
1.8085 times |
Thu 04 December 2025 |
108.10 (-9.84%) |
118.95 |
105.50 - 118.95 |
0.8424 times |
Wed 03 December 2025 |
119.90 (-2.44%) |
120.00 |
119.00 - 120.00 |
0.0486 times |
Tue 02 December 2025 |
122.90 (4.6%) |
129.95 |
117.65 - 129.95 |
0.044 times |
Mon 01 December 2025 |
117.50 (-6%) |
120.50 |
116.00 - 125.00 |
0.4237 times |
Fri 28 November 2025 |
125.00 (-1.92%) |
127.45 |
123.00 - 128.90 |
0.4462 times |
Thu 27 November 2025 |
127.45 (-1.7%) |
128.10 |
127.40 - 128.10 |
0.0706 times |
Wed 26 November 2025 |
129.65 (-2.56%) |
128.10 |
128.10 - 131.65 |
0.2021 times |
Tue 25 November 2025 |
133.05 (-1.15%) |
143.00 |
129.25 - 143.00 |
0.125 times |
Mon 24 November 2025 |
134.60 (3.46%) |
139.90 |
126.80 - 156.10 |
5.989 times |
Fri 21 November 2025 |
130.10 (-3.63%) |
126.10 |
126.10 - 131.00 |
0.0251 times |
Weekly price and charts SanrheaTech Strong weekly Stock price targets for SanrheaTech 514280 are 92.83 and 124.53 | Weekly Target 1 | 84.07 | | Weekly Target 2 | 101.58 | | Weekly Target 3 | 115.76666666667 | | Weekly Target 4 | 133.28 | | Weekly Target 5 | 147.47 |
Weekly price and volumes for Sanrhea Tech
| Date |
Closing |
Open |
Range |
Volume |
Fri 05 December 2025 |
119.10 (-4.72%) |
120.50 |
98.25 - 129.95 |
1.8535 times |
Fri 28 November 2025 |
125.00 (-3.92%) |
139.90 |
123.00 - 156.10 |
3.9987 times |
Fri 21 November 2025 |
130.10 (-11.89%) |
148.05 |
126.10 - 154.90 |
0.3015 times |
Fri 14 November 2025 |
147.65 (-4.28%) |
153.95 |
146.60 - 179.40 |
0.7834 times |
Fri 07 November 2025 |
154.25 (1.61%) |
151.50 |
148.85 - 164.90 |
0.456 times |
Fri 31 October 2025 |
151.80 (1.5%) |
145.20 |
142.00 - 165.00 |
0.4131 times |
Thu 23 October 2025 |
149.55 (-2.29%) |
152.40 |
128.00 - 165.95 |
0.8033 times |
Fri 17 October 2025 |
153.05 (12.54%) |
135.35 |
130.60 - 155.00 |
0.5891 times |
Fri 10 October 2025 |
136.00 (-7.48%) |
141.10 |
130.00 - 145.00 |
0.4371 times |
Fri 03 October 2025 |
147.00 (8.69%) |
132.00 |
125.00 - 152.80 |
0.3643 times |
Fri 26 September 2025 |
135.25 (-4.79%) |
142.05 |
127.05 - 169.70 |
1.1795 times |

Monthly price and charts SanrheaTech Strong monthly Stock price targets for SanrheaTech 514280 are 92.83 and 124.53 | Monthly Target 1 | 84.07 | | Monthly Target 2 | 101.58 | | Monthly Target 3 | 115.76666666667 | | Monthly Target 4 | 133.28 | | Monthly Target 5 | 147.47 |
Monthly price and volumes Sanrhea Tech
| Date |
Closing |
Open |
Range |
Volume |
Fri 05 December 2025 |
119.10 (-4.72%) |
120.50 |
98.25 - 129.95 |
0.5415 times |
Fri 28 November 2025 |
125.00 (-17.65%) |
151.50 |
123.00 - 179.40 |
1.6184 times |
Fri 31 October 2025 |
151.80 (8.12%) |
145.00 |
128.00 - 165.95 |
0.675 times |
Tue 30 September 2025 |
140.40 (12.86%) |
124.95 |
110.00 - 173.60 |
3.8278 times |
Fri 29 August 2025 |
124.40 (-8.56%) |
136.10 |
106.60 - 154.00 |
0.4508 times |
Thu 31 July 2025 |
136.05 (-6.17%) |
159.40 |
126.35 - 159.40 |
0.6387 times |
Mon 30 June 2025 |
145.00 (-3.33%) |
143.05 |
131.20 - 161.80 |
0.4056 times |
Fri 30 May 2025 |
150.00 (-2.28%) |
148.00 |
135.50 - 160.00 |
0.5416 times |
Wed 30 April 2025 |
153.50 (49.03%) |
103.00 |
100.10 - 164.95 |
0.7667 times |
Fri 28 March 2025 |
103.00 (-11.74%) |
124.15 |
95.55 - 127.85 |
0.5339 times |
Fri 28 February 2025 |
116.70 (-28.84%) |
148.55 |
95.20 - 172.90 |
0.7473 times |

DMA SMA EMA moving averages of Sanrhea Tech 514280
DMA (daily moving average) of Sanrhea Tech 514280
| DMA period | DMA value | | 5 day DMA | 117.5 | | 12 day DMA | 125.2 | | 20 day DMA | 135.29 | | 35 day DMA | 141.08 | | 50 day DMA | 141.11 | | 100 day DMA | 138.33 | | 150 day DMA | 141.05 | | 200 day DMA | 136.81 | EMA (exponential moving average) of Sanrhea Tech 514280
| EMA period | EMA current | EMA prev | EMA prev2 | | 5 day EMA | 118.39 | 118.04 | 123.01 | | 12 day EMA | 125.12 | 126.21 | 129.5 | | 20 day EMA | 130.6 | 131.81 | 134.31 | | 35 day EMA | 135.2 | 136.15 | 137.8 | | 50 day EMA | 138.78 | 139.58 | 140.86 |
SMA (simple moving average) of Sanrhea Tech 514280
| SMA period | SMA current | SMA prev | SMA prev2 | | 5 day SMA | 117.5 | 118.68 | 122.55 | | 12 day SMA | 125.2 | 126.55 | 129.53 | | 20 day SMA | 135.29 | 136.85 | 139.19 | | 35 day SMA | 141.08 | 141.64 | 142.44 | | 50 day SMA | 141.11 | 141.57 | 142.24 | | 100 day SMA | 138.33 | 138.57 | 138.93 | | 150 day SMA | 141.05 | 141.3 | 141.58 | | 200 day SMA | 136.81 | 136.96 | 137.16 |
|
|
