HindCopper 513599 full analysis,charts,indicators,moving averages,SMA,DMA,EMA,ADX,MACD,RSIHind Copper 513599 WideScreen charts, DMA,SMA,EMA technical analysis, forecast prediction, by indicators ADX,MACD,RSI,CCI BSE stock exchange
Daily price and charts and targets HindCopper Strong Daily Stock price targets for HindCopper 513599 are 342.03 and 348.23 | Daily Target 1 | 340.7 | | Daily Target 2 | 343.35 | | Daily Target 3 | 346.9 | | Daily Target 4 | 349.55 | | Daily Target 5 | 353.1 |
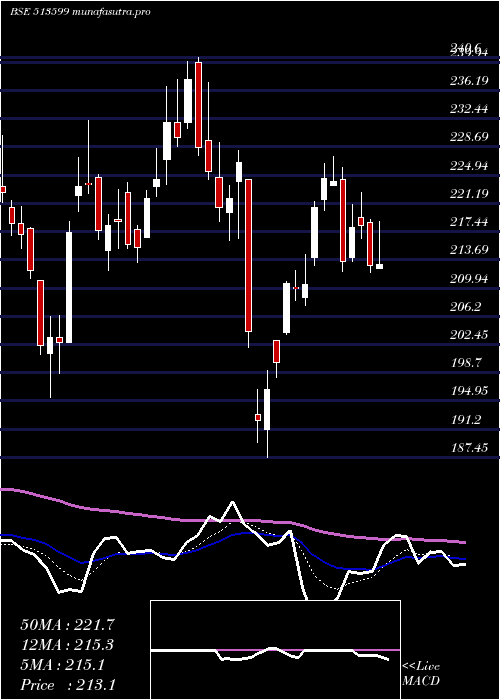
Daily price and volume Hind Copper
| Date |
Closing |
Open |
Range |
Volume |
Tue 21 October 2025 |
346.00 (0.3%) |
347.65 |
344.25 - 350.45 |
0.1722 times |
Mon 20 October 2025 |
344.95 (0.85%) |
344.50 |
336.05 - 349.60 |
1.5836 times |
Fri 17 October 2025 |
342.05 (-0.12%) |
342.25 |
337.80 - 347.00 |
0.6219 times |
Thu 16 October 2025 |
342.45 (0.16%) |
344.60 |
340.50 - 347.00 |
0.5457 times |
Wed 15 October 2025 |
341.90 (3.57%) |
333.65 |
330.25 - 343.25 |
0.5716 times |
Tue 14 October 2025 |
330.10 (-3.13%) |
346.00 |
328.90 - 353.25 |
0.6682 times |
Mon 13 October 2025 |
340.75 (-1.09%) |
345.30 |
337.55 - 348.00 |
0.6395 times |
Fri 10 October 2025 |
344.50 (-5.4%) |
363.80 |
341.15 - 365.00 |
1.6023 times |
Thu 09 October 2025 |
364.15 (6.43%) |
342.15 |
341.35 - 365.50 |
2.5805 times |
Wed 08 October 2025 |
342.15 (2.84%) |
332.75 |
331.80 - 343.90 |
1.0145 times |
Tue 07 October 2025 |
332.70 (-1.61%) |
339.00 |
332.00 - 348.80 |
1.1489 times |
Weekly price and charts HindCopper Strong weekly Stock price targets for HindCopper 513599 are 341.03 and 355.43 | Weekly Target 1 | 329.77 | | Weekly Target 2 | 337.88 | | Weekly Target 3 | 344.16666666667 | | Weekly Target 4 | 352.28 | | Weekly Target 5 | 358.57 |
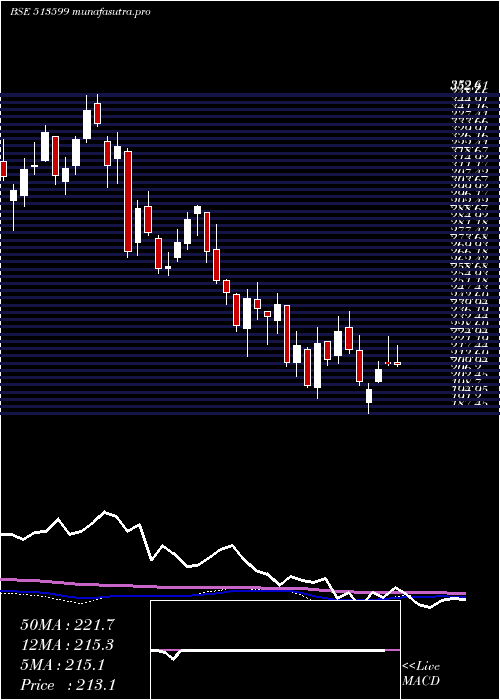
Weekly price and volumes for Hind Copper
| Date |
Closing |
Open |
Range |
Volume |
Tue 21 October 2025 |
346.00 (1.15%) |
344.50 |
336.05 - 350.45 |
0.4992 times |
Fri 17 October 2025 |
342.05 (-0.71%) |
345.30 |
328.90 - 353.25 |
0.8662 times |
Fri 10 October 2025 |
344.50 (1.89%) |
344.70 |
331.80 - 365.50 |
1.9677 times |
Fri 03 October 2025 |
338.10 (8.38%) |
316.80 |
310.45 - 343.70 |
1.4212 times |
Fri 26 September 2025 |
311.95 (10.39%) |
282.95 |
282.00 - 330.80 |
2.4543 times |
Fri 19 September 2025 |
282.60 (0.86%) |
280.20 |
276.55 - 294.20 |
0.9697 times |
Fri 12 September 2025 |
280.20 (14.74%) |
244.35 |
241.55 - 283.60 |
1.2811 times |
Fri 05 September 2025 |
244.20 (6.27%) |
226.25 |
226.25 - 251.20 |
0.2654 times |
Fri 29 August 2025 |
229.80 (-3.34%) |
238.10 |
226.70 - 239.75 |
0.1272 times |
Fri 22 August 2025 |
237.75 (-0.98%) |
242.70 |
236.55 - 244.60 |
0.148 times |
Thu 14 August 2025 |
240.10 (1.18%) |
237.55 |
234.00 - 243.55 |
0.1888 times |
Monthly price and charts HindCopper Strong monthly Stock price targets for HindCopper 513599 are 334.3 and 377.2 | Monthly Target 1 | 301.8 | | Monthly Target 2 | 323.9 | | Monthly Target 3 | 344.7 | | Monthly Target 4 | 366.8 | | Monthly Target 5 | 387.6 |
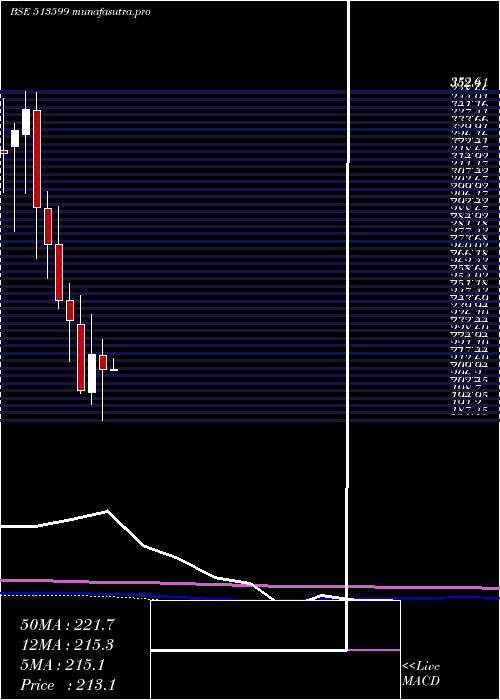
Monthly price and volumes Hind Copper
| Date |
Closing |
Open |
Range |
Volume |
Tue 21 October 2025 |
346.00 (5.04%) |
329.80 |
322.60 - 365.50 |
1.2922 times |
Tue 30 September 2025 |
329.40 (43.34%) |
226.25 |
226.25 - 336.40 |
2.0106 times |
Fri 29 August 2025 |
229.80 (-5.57%) |
243.25 |
226.70 - 251.90 |
0.4175 times |
Thu 31 July 2025 |
243.35 (-12.89%) |
280.90 |
241.80 - 287.50 |
0.6937 times |
Mon 30 June 2025 |
279.35 (12.91%) |
246.00 |
243.00 - 285.95 |
1.1553 times |
Fri 30 May 2025 |
247.40 (16.2%) |
212.60 |
197.70 - 258.00 |
1.201 times |
Wed 30 April 2025 |
212.90 (-3.49%) |
220.00 |
187.45 - 228.15 |
0.425 times |
Fri 28 March 2025 |
220.60 (9.02%) |
201.30 |
195.35 - 240.60 |
1.2928 times |
Fri 28 February 2025 |
202.35 (-14.94%) |
235.55 |
201.10 - 250.00 |
0.6537 times |
Fri 31 January 2025 |
237.90 (-4.03%) |
247.90 |
217.10 - 256.50 |
0.8582 times |
Tue 31 December 2024 |
247.90 (-10.16%) |
275.75 |
243.90 - 295.20 |
0.6981 times |
DMA SMA EMA moving averages of Hind Copper 513599
DMA (daily moving average) of Hind Copper 513599
| DMA period | DMA value | | 5 day DMA | 343.47 | | 12 day DMA | 342.49 | | 20 day DMA | 334.4 | | 35 day DMA | 303.92 | | 50 day DMA | 283.91 | | 100 day DMA | 272.28 | | 150 day DMA | 255.08 | | 200 day DMA | 249.56 | EMA (exponential moving average) of Hind Copper 513599
| EMA period | EMA current | EMA prev | EMA prev2 | | 5 day EMA | 343.64 | 342.46 | 341.22 | | 12 day EMA | 338.76 | 337.45 | 336.09 | | 20 day EMA | 329.07 | 327.29 | 325.43 | | 35 day EMA | 309.35 | 307.19 | 304.97 | | 50 day EMA | 286.48 | 284.05 | 281.57 |
SMA (simple moving average) of Hind Copper 513599
| SMA period | SMA current | SMA prev | SMA prev2 | | 5 day SMA | 343.47 | 340.29 | 339.45 | | 12 day SMA | 342.49 | 341.83 | 341.02 | | 20 day SMA | 334.4 | 331.92 | 328.8 | | 35 day SMA | 303.92 | 300.68 | 297.39 | | 50 day SMA | 283.91 | 281.82 | 279.82 | | 100 day SMA | 272.28 | 271.31 | 270.31 | | 150 day SMA | 255.08 | 254.22 | 253.27 | | 200 day SMA | 249.56 | 249.18 | 248.82 |
|
|
