Pittieng 513519 full analysis,charts,indicators,moving averages,SMA,DMA,EMA,ADX,MACD,RSIPittieng 513519 WideScreen charts, DMA,SMA,EMA technical analysis, forecast prediction, by indicators ADX,MACD,RSI,CCI BSE stock exchange
Daily price and charts and targets Pittieng Strong Daily Stock price targets for Pittieng 513519 are 890.95 and 954.65 | Daily Target 1 | 879.82 | | Daily Target 2 | 902.08 | | Daily Target 3 | 943.51666666667 | | Daily Target 4 | 965.78 | | Daily Target 5 | 1007.22 |
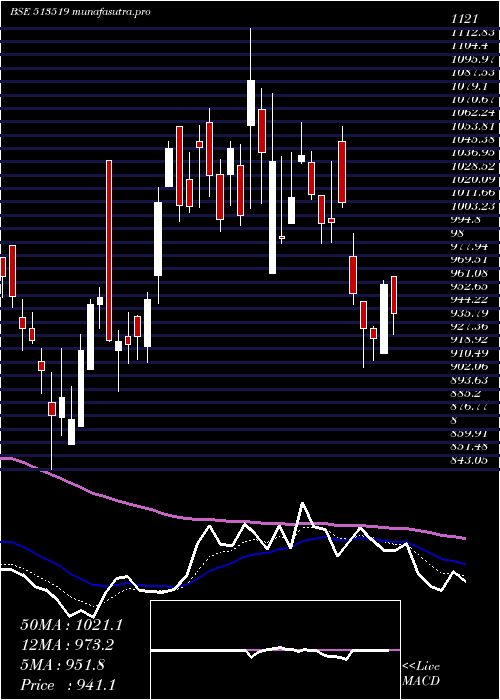
Daily price and volume Pittieng
| Date |
Closing |
Open |
Range |
Volume |
Tue 21 October 2025 |
924.35 (-0.58%) |
984.95 |
921.25 - 984.95 |
0.5849 times |
Mon 20 October 2025 |
929.75 (1.57%) |
896.05 |
896.05 - 975.60 |
0.3619 times |
Fri 17 October 2025 |
915.35 (-0.78%) |
921.00 |
900.10 - 935.05 |
1.4179 times |
Thu 16 October 2025 |
922.50 (-1.06%) |
935.25 |
917.10 - 940.00 |
1.5034 times |
Wed 15 October 2025 |
932.40 (-1.76%) |
967.95 |
932.35 - 967.95 |
0.5551 times |
Tue 14 October 2025 |
949.10 (0.28%) |
946.45 |
928.90 - 960.00 |
1.1224 times |
Mon 13 October 2025 |
946.45 (-2.61%) |
960.10 |
945.00 - 963.75 |
1.0285 times |
Fri 10 October 2025 |
971.85 (0.43%) |
980.00 |
960.10 - 985.00 |
0.3138 times |
Thu 09 October 2025 |
967.65 (-0.28%) |
984.30 |
957.00 - 984.30 |
0.7612 times |
Wed 08 October 2025 |
970.40 (-0.57%) |
975.55 |
968.30 - 990.30 |
2.3509 times |
Tue 07 October 2025 |
975.95 (-0.15%) |
981.45 |
967.35 - 985.30 |
1.6057 times |
Weekly price and charts Pittieng Strong weekly Stock price targets for Pittieng 513519 are 910.2 and 999.1 | Weekly Target 1 | 846.22 | | Weekly Target 2 | 885.28 | | Weekly Target 3 | 935.11666666667 | | Weekly Target 4 | 974.18 | | Weekly Target 5 | 1024.02 |
Weekly price and volumes for Pittieng
| Date |
Closing |
Open |
Range |
Volume |
Tue 21 October 2025 |
924.35 (0.98%) |
896.05 |
896.05 - 984.95 |
0.0087 times |
Fri 17 October 2025 |
915.35 (-5.81%) |
960.10 |
900.10 - 967.95 |
0.0519 times |
Fri 10 October 2025 |
971.85 (-2.45%) |
982.20 |
957.00 - 1000.25 |
0.0739 times |
Fri 03 October 2025 |
996.25 (-1.37%) |
991.05 |
968.30 - 1025.25 |
0.1096 times |
Fri 26 September 2025 |
1010.05 (0.51%) |
999.25 |
980.10 - 1030.00 |
0.2269 times |
Fri 19 September 2025 |
1004.90 (9.53%) |
906.20 |
906.20 - 1069.85 |
9.0469 times |
Fri 12 September 2025 |
917.50 (1.09%) |
909.40 |
864.60 - 945.75 |
0.1609 times |
Fri 05 September 2025 |
907.60 (-2.17%) |
907.05 |
890.55 - 934.15 |
0.0846 times |
Fri 29 August 2025 |
927.75 (-2.25%) |
963.70 |
905.05 - 970.00 |
0.0927 times |
Fri 22 August 2025 |
949.10 (-2.56%) |
971.05 |
940.90 - 990.60 |
0.144 times |
Thu 14 August 2025 |
974.05 (6.42%) |
972.70 |
911.10 - 977.50 |
0.1631 times |

Monthly price and charts Pittieng Strong monthly Stock price targets for Pittieng 513519 are 848.23 and 972.18 | Monthly Target 1 | 822.85 | | Monthly Target 2 | 873.6 | | Monthly Target 3 | 946.8 | | Monthly Target 4 | 997.55 | | Monthly Target 5 | 1070.75 |
Monthly price and volumes Pittieng
| Date |
Closing |
Open |
Range |
Volume |
Tue 21 October 2025 |
924.35 (-7.22%) |
985.10 |
896.05 - 1020.00 |
0.1012 times |
Tue 30 September 2025 |
996.30 (7.39%) |
907.05 |
864.60 - 1069.85 |
6.2845 times |
Fri 29 August 2025 |
927.75 (-1.49%) |
940.05 |
877.00 - 990.60 |
0.3336 times |
Thu 31 July 2025 |
941.80 (-7.13%) |
1014.35 |
890.20 - 1042.90 |
0.7015 times |
Mon 30 June 2025 |
1014.10 (2.58%) |
970.05 |
938.20 - 1049.15 |
0.3192 times |
Fri 30 May 2025 |
988.60 (5.05%) |
942.60 |
836.05 - 1025.00 |
0.3884 times |
Wed 30 April 2025 |
941.05 (-9.99%) |
1034.60 |
907.45 - 1121.00 |
0.7181 times |
Fri 28 March 2025 |
1045.45 (19.26%) |
875.70 |
858.55 - 1070.50 |
0.4624 times |
Fri 28 February 2025 |
876.60 (-23.91%) |
1199.75 |
843.05 - 1199.75 |
0.4116 times |
Fri 31 January 2025 |
1152.00 (-12.59%) |
1309.05 |
1078.30 - 1399.95 |
0.2794 times |
Tue 31 December 2024 |
1317.95 (-9.75%) |
1442.05 |
1309.00 - 1511.45 |
1.6894 times |

DMA SMA EMA moving averages of Pittieng 513519
DMA (daily moving average) of Pittieng 513519
| DMA period | DMA value | | 5 day DMA | 924.87 | | 12 day DMA | 948.6 | | 20 day DMA | 969.76 | | 35 day DMA | 955.19 | | 50 day DMA | 952.49 | | 100 day DMA | 962.55 | | 150 day DMA | 968.31 | | 200 day DMA | 1011.59 | EMA (exponential moving average) of Pittieng 513519
| EMA period | EMA current | EMA prev | EMA prev2 | | 5 day EMA | 929.26 | 931.72 | 932.7 | | 12 day EMA | 944.53 | 948.2 | 951.55 | | 20 day EMA | 952.2 | 955.13 | 957.8 | | 35 day EMA | 952.64 | 954.31 | 955.76 | | 50 day EMA | 946.58 | 947.49 | 948.21 |
SMA (simple moving average) of Pittieng 513519
| SMA period | SMA current | SMA prev | SMA prev2 | | 5 day SMA | 924.87 | 929.82 | 933.16 | | 12 day SMA | 948.6 | 954.59 | 960.88 | | 20 day SMA | 969.76 | 974.3 | 978.06 | | 35 day SMA | 955.19 | 955.03 | 954.98 | | 50 day SMA | 952.49 | 951.76 | 951.57 | | 100 day SMA | 962.55 | 963.26 | 964.06 | | 150 day SMA | 968.31 | 968.27 | 967.9 | | 200 day SMA | 1011.59 | 1013.81 | 1015.93 |
|
|
