PanchSteel 513511 full analysis,charts,indicators,moving averages,SMA,DMA,EMA,ADX,MACD,RSIPanch Steel 513511 WideScreen charts, DMA,SMA,EMA technical analysis, forecast prediction, by indicators ADX,MACD,RSI,CCI BSE stock exchange
Daily price and charts and targets PanchSteel Strong Daily Stock price targets for PanchSteel 513511 are 259.68 and 273.68 | Daily Target 1 | 257.12 | | Daily Target 2 | 262.23 | | Daily Target 3 | 271.11666666667 | | Daily Target 4 | 276.23 | | Daily Target 5 | 285.12 |
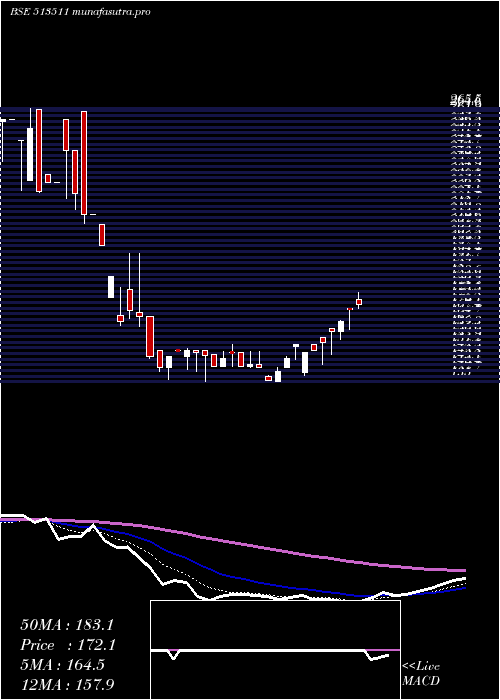
Daily price and volume Panch Steel
| Date |
Closing |
Open |
Range |
Volume |
Thu 23 October 2025 |
267.35 (-2.83%) |
275.15 |
266.00 - 280.00 |
0.1229 times |
Tue 21 October 2025 |
275.15 (-1.31%) |
289.90 |
261.30 - 289.90 |
0.0342 times |
Mon 20 October 2025 |
278.80 (2.67%) |
272.00 |
270.00 - 280.00 |
0.529 times |
Fri 17 October 2025 |
271.55 (-4.05%) |
283.00 |
267.20 - 289.90 |
3.4815 times |
Thu 16 October 2025 |
283.00 (1.73%) |
294.25 |
280.00 - 294.25 |
0.2776 times |
Wed 15 October 2025 |
278.20 (-2.57%) |
296.00 |
276.50 - 296.00 |
0.0614 times |
Tue 14 October 2025 |
285.55 (-2.04%) |
307.40 |
281.10 - 307.40 |
0.0539 times |
Mon 13 October 2025 |
291.50 (2.77%) |
284.00 |
278.55 - 295.00 |
0.3681 times |
Fri 10 October 2025 |
283.65 (-3.57%) |
306.95 |
272.10 - 315.00 |
2.5835 times |
Thu 09 October 2025 |
294.15 (-1.33%) |
319.00 |
276.35 - 319.00 |
2.4878 times |
Wed 08 October 2025 |
298.10 (10.41%) |
279.90 |
270.00 - 309.85 |
2.2102 times |
Weekly price and charts PanchSteel Strong weekly Stock price targets for PanchSteel 513511 are 250.03 and 278.63 | Weekly Target 1 | 244.25 | | Weekly Target 2 | 255.8 | | Weekly Target 3 | 272.85 | | Weekly Target 4 | 284.4 | | Weekly Target 5 | 301.45 |
Weekly price and volumes for Panch Steel
| Date |
Closing |
Open |
Range |
Volume |
Thu 23 October 2025 |
267.35 (-1.55%) |
272.00 |
261.30 - 289.90 |
0.2281 times |
Fri 17 October 2025 |
271.55 (-4.27%) |
284.00 |
267.20 - 307.40 |
1.4106 times |
Fri 10 October 2025 |
283.65 (7.14%) |
264.00 |
262.00 - 319.00 |
2.4991 times |
Fri 03 October 2025 |
264.75 (-5.38%) |
280.00 |
261.00 - 308.70 |
2.04 times |
Fri 26 September 2025 |
279.80 (-3.55%) |
309.00 |
267.60 - 313.95 |
0.4526 times |
Fri 19 September 2025 |
290.10 (11.15%) |
282.95 |
252.10 - 310.65 |
1.2038 times |
Fri 12 September 2025 |
261.00 (-4.38%) |
272.00 |
252.05 - 272.05 |
0.373 times |
Fri 05 September 2025 |
272.95 (2.23%) |
272.40 |
252.00 - 274.95 |
0.5853 times |
Fri 29 August 2025 |
267.00 (-2.14%) |
272.85 |
260.00 - 274.90 |
0.3698 times |
Fri 22 August 2025 |
272.85 (3.69%) |
274.00 |
242.00 - 274.45 |
0.8376 times |
Thu 14 August 2025 |
263.15 (0.82%) |
274.00 |
245.00 - 274.00 |
0.9513 times |

Monthly price and charts PanchSteel Strong monthly Stock price targets for PanchSteel 513511 are 235.18 and 293.18 | Monthly Target 1 | 224.45 | | Monthly Target 2 | 245.9 | | Monthly Target 3 | 282.45 | | Monthly Target 4 | 303.9 | | Monthly Target 5 | 340.45 |
Monthly price and volumes Panch Steel
| Date |
Closing |
Open |
Range |
Volume |
Thu 23 October 2025 |
267.35 (-9.06%) |
285.00 |
261.00 - 319.00 |
0.7809 times |
Tue 30 September 2025 |
294.00 (10.11%) |
272.40 |
252.00 - 313.95 |
0.3756 times |
Fri 29 August 2025 |
267.00 (4.09%) |
261.00 |
242.00 - 274.90 |
0.3608 times |
Thu 31 July 2025 |
256.50 (19.3%) |
215.00 |
215.00 - 263.00 |
1.5924 times |
Mon 30 June 2025 |
215.00 (42.38%) |
151.00 |
144.00 - 215.00 |
3.1168 times |
Fri 30 May 2025 |
151.00 (-12.16%) |
175.30 |
149.95 - 175.30 |
0.2173 times |
Wed 30 April 2025 |
171.90 (26.68%) |
135.05 |
135.05 - 177.95 |
0.1218 times |
Fri 28 March 2025 |
135.70 (-32.18%) |
175.20 |
135.00 - 196.35 |
2.3095 times |
Fri 28 February 2025 |
200.10 (-19.96%) |
259.95 |
200.10 - 265.50 |
0.4248 times |
Fri 31 January 2025 |
250.00 (0.97%) |
243.00 |
232.05 - 299.40 |
0.7001 times |
Tue 31 December 2024 |
247.60 (5.36%) |
238.00 |
223.00 - 279.90 |
0.3638 times |

DMA SMA EMA moving averages of Panch Steel 513511
DMA (daily moving average) of Panch Steel 513511
| DMA period | DMA value | | 5 day DMA | 275.17 | | 12 day DMA | 281.42 | | 20 day DMA | 282.83 | | 35 day DMA | 280.75 | | 50 day DMA | 276.02 | | 100 day DMA | 246.62 | | 150 day DMA | 216.55 | | 200 day DMA | 224.69 | EMA (exponential moving average) of Panch Steel 513511
| EMA period | EMA current | EMA prev | EMA prev2 | | 5 day EMA | 274.4 | 277.93 | 279.32 | | 12 day EMA | 278.65 | 280.7 | 281.71 | | 20 day EMA | 279.85 | 281.17 | 281.8 | | 35 day EMA | 277.44 | 278.03 | 278.2 | | 50 day EMA | 274.3 | 274.58 | 274.56 |
SMA (simple moving average) of Panch Steel 513511
| SMA period | SMA current | SMA prev | SMA prev2 | | 5 day SMA | 275.17 | 277.34 | 279.42 | | 12 day SMA | 281.42 | 280.97 | 280.1 | | 20 day SMA | 282.83 | 284.39 | 285.63 | | 35 day SMA | 280.75 | 280.82 | 280.68 | | 50 day SMA | 276.02 | 275.89 | 275.53 | | 100 day SMA | 246.62 | 245.46 | 244.25 | | 150 day SMA | 216.55 | 215.89 | 215.15 | | 200 day SMA | 224.69 | 224.68 | 224.59 |
|
|
