SouthMagnes 513498 full analysis,charts,indicators,moving averages,SMA,DMA,EMA,ADX,MACD,RSISouth Magnes 513498 WideScreen charts, DMA,SMA,EMA technical analysis, forecast prediction, by indicators ADX,MACD,RSI,CCI BSE stock exchange
Daily price and charts and targets SouthMagnes Strong Daily Stock price targets for SouthMagnes 513498 are 148.8 and 156.4 | Daily Target 1 | 142.47 | | Daily Target 2 | 147.53 | | Daily Target 3 | 150.06666666667 | | Daily Target 4 | 155.13 | | Daily Target 5 | 157.67 |
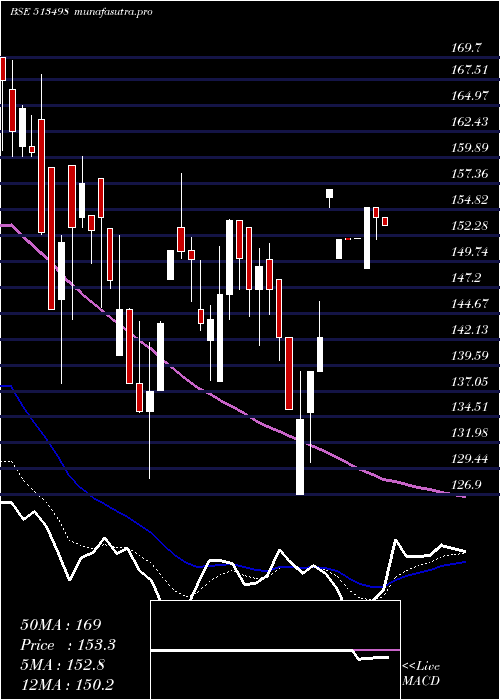
Daily price and volume South Magnes
| Date |
Closing |
Open |
Range |
Volume |
Tue 15 July 2025 |
152.60 (9.98%) |
145.00 |
145.00 - 152.60 |
3.4305 times |
Mon 14 July 2025 |
138.75 (9.99%) |
138.70 |
130.00 - 138.75 |
3.0128 times |
Fri 11 July 2025 |
126.15 (0.36%) |
131.90 |
125.80 - 131.90 |
0.5968 times |
Thu 10 July 2025 |
125.70 (-2.41%) |
128.80 |
125.00 - 128.80 |
0.6896 times |
Wed 09 July 2025 |
128.80 (-0.77%) |
130.00 |
128.80 - 130.00 |
0.2784 times |
Tue 08 July 2025 |
129.80 (-0.15%) |
128.40 |
128.40 - 130.00 |
0.0798 times |
Mon 07 July 2025 |
130.00 (1.52%) |
130.00 |
127.30 - 132.95 |
0.1457 times |
Fri 04 July 2025 |
128.05 (0.87%) |
126.95 |
126.95 - 133.25 |
0.5931 times |
Thu 03 July 2025 |
126.95 (-1.59%) |
127.00 |
125.10 - 130.00 |
0.3821 times |
Wed 02 July 2025 |
129.00 (0.86%) |
121.55 |
121.55 - 129.65 |
0.7911 times |
Tue 01 July 2025 |
127.90 (-4.45%) |
133.70 |
127.20 - 133.85 |
0.5532 times |
Weekly price and charts SouthMagnes Strong weekly Stock price targets for SouthMagnes 513498 are 141.3 and 163.9 | Weekly Target 1 | 122.47 | | Weekly Target 2 | 137.53 | | Weekly Target 3 | 145.06666666667 | | Weekly Target 4 | 160.13 | | Weekly Target 5 | 167.67 |
Weekly price and volumes for South Magnes
| Date |
Closing |
Open |
Range |
Volume |
Tue 15 July 2025 |
152.60 (20.97%) |
138.70 |
130.00 - 152.60 |
2.4631 times |
Fri 11 July 2025 |
126.15 (-1.48%) |
130.00 |
125.00 - 132.95 |
0.6844 times |
Fri 04 July 2025 |
128.05 (-2.44%) |
131.90 |
121.55 - 135.95 |
1.2262 times |
Fri 27 June 2025 |
131.25 (10.29%) |
119.80 |
119.80 - 131.25 |
0.4033 times |
Thu 19 June 2025 |
119.00 (-6.3%) |
127.00 |
119.00 - 127.00 |
0.807 times |
Fri 13 June 2025 |
127.00 (-7.57%) |
134.70 |
125.00 - 134.70 |
1.2437 times |
Fri 06 June 2025 |
137.40 (-9.55%) |
148.90 |
137.40 - 148.90 |
0.3251 times |
Fri 30 May 2025 |
151.90 (-2.63%) |
154.00 |
149.95 - 159.10 |
0.512 times |
Fri 23 May 2025 |
156.00 (9.67%) |
149.00 |
147.95 - 161.50 |
1.0519 times |
Fri 16 May 2025 |
142.25 (6.28%) |
133.85 |
128.00 - 142.25 |
1.2832 times |
Fri 09 May 2025 |
133.85 (-7.69%) |
142.10 |
133.85 - 142.10 |
0.2388 times |

Monthly price and charts SouthMagnes Strong monthly Stock price targets for SouthMagnes 513498 are 137.08 and 168.13 | Monthly Target 1 | 111.2 | | Monthly Target 2 | 131.9 | | Monthly Target 3 | 142.25 | | Monthly Target 4 | 162.95 | | Monthly Target 5 | 173.3 |
Monthly price and volumes South Magnes
| Date |
Closing |
Open |
Range |
Volume |
Tue 15 July 2025 |
152.60 (14.01%) |
133.70 |
121.55 - 152.60 |
0.6687 times |
Mon 30 June 2025 |
133.85 (-11.88%) |
148.90 |
119.00 - 148.90 |
0.5169 times |
Fri 30 May 2025 |
151.90 (2.67%) |
145.00 |
128.00 - 161.50 |
0.5138 times |
Wed 30 April 2025 |
147.95 (10.16%) |
134.95 |
130.05 - 156.80 |
0.1872 times |
Fri 28 March 2025 |
134.30 (-7.38%) |
145.00 |
126.90 - 158.35 |
0.9111 times |
Fri 28 February 2025 |
145.00 (-36.96%) |
226.00 |
137.75 - 243.50 |
1.1136 times |
Fri 31 January 2025 |
230.00 (-9.64%) |
261.00 |
212.35 - 278.45 |
0.6375 times |
Tue 31 December 2024 |
254.55 (-3.27%) |
252.15 |
251.00 - 349.00 |
2.9756 times |
Fri 29 November 2024 |
263.15 (-14.45%) |
314.95 |
224.15 - 331.35 |
1.383 times |
Thu 31 October 2024 |
307.60 (-5.02%) |
330.30 |
289.55 - 389.85 |
1.0925 times |
Mon 30 September 2024 |
323.85 (-25.15%) |
424.00 |
315.00 - 424.00 |
0.9583 times |

DMA SMA EMA moving averages of South Magnes 513498
DMA (daily moving average) of South Magnes 513498
| DMA period | DMA value | | 5 day DMA | 134.4 | | 12 day DMA | 131.46 | | 20 day DMA | 128.57 | | 35 day DMA | 133.64 | | 50 day DMA | 136.42 | | 100 day DMA | 143.05 | | 150 day DMA | 183.08 | | 200 day DMA | 215.35 | EMA (exponential moving average) of South Magnes 513498
| EMA period | EMA current | EMA prev | EMA prev2 | | 5 day EMA | 138.29 | 131.14 | 127.33 | | 12 day EMA | 133.2 | 129.67 | 128.02 | | 20 day EMA | 132.22 | 130.08 | 129.17 | | 35 day EMA | 134.07 | 132.98 | 132.64 | | 50 day EMA | 137.15 | 136.52 | 136.43 |
SMA (simple moving average) of South Magnes 513498
| SMA period | SMA current | SMA prev | SMA prev2 | | 5 day SMA | 134.4 | 129.84 | 128.09 | | 12 day SMA | 131.46 | 129.68 | 128.85 | | 20 day SMA | 128.57 | 127.16 | 126.58 | | 35 day SMA | 133.64 | 133.65 | 134.14 | | 50 day SMA | 136.42 | 136.21 | 136.33 | | 100 day SMA | 143.05 | 143.17 | 143.62 | | 150 day SMA | 183.08 | 183.83 | 184.7 | | 200 day SMA | 215.35 | 216.35 | 217.46 |
|
|
