KanishkSt 513456 full analysis,charts,indicators,moving averages,SMA,DMA,EMA,ADX,MACD,RSIKanishk St 513456 WideScreen charts, DMA,SMA,EMA technical analysis, forecast prediction, by indicators ADX,MACD,RSI,CCI BSE stock exchange
Daily price and charts and targets KanishkSt Strong Daily Stock price targets for KanishkSt 513456 are 48.1 and 50.89 | Daily Target 1 | 47.6 | | Daily Target 2 | 48.59 | | Daily Target 3 | 50.393333333333 | | Daily Target 4 | 51.38 | | Daily Target 5 | 53.18 |
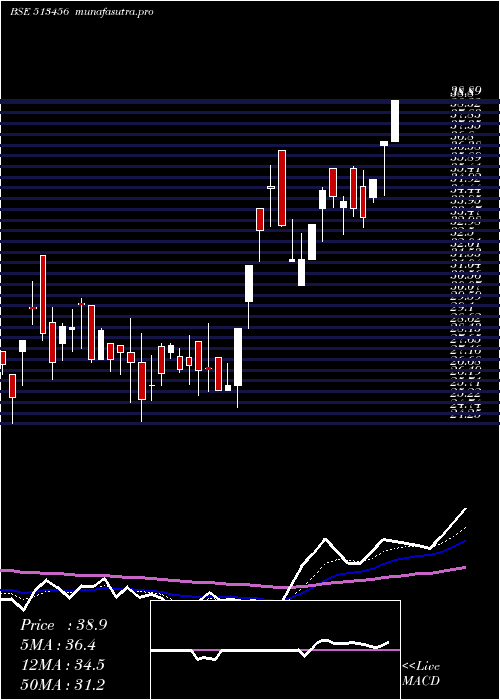
Daily price and volume Kanishk St
| Date |
Closing |
Open |
Range |
Volume |
Tue 21 October 2025 |
49.57 (0.94%) |
52.20 |
49.41 - 52.20 |
0.1337 times |
Mon 20 October 2025 |
49.11 (1.49%) |
47.50 |
47.42 - 53.19 |
0.188 times |
Fri 17 October 2025 |
48.39 (-2.28%) |
52.40 |
48.22 - 52.40 |
0.1527 times |
Thu 16 October 2025 |
49.52 (-0.96%) |
49.75 |
49.00 - 51.45 |
0.7947 times |
Wed 15 October 2025 |
50.00 (1.19%) |
50.15 |
47.76 - 50.15 |
0.2133 times |
Tue 14 October 2025 |
49.41 (-2.35%) |
50.87 |
48.36 - 52.49 |
6.0572 times |
Mon 13 October 2025 |
50.60 (-4.47%) |
53.23 |
49.17 - 53.23 |
0.4259 times |
Fri 10 October 2025 |
52.97 (-0.38%) |
54.23 |
51.31 - 54.23 |
0.3458 times |
Thu 09 October 2025 |
53.17 (4.25%) |
55.00 |
51.10 - 56.10 |
1.0787 times |
Wed 08 October 2025 |
51.00 (2.55%) |
52.90 |
49.10 - 54.70 |
0.61 times |
Tue 07 October 2025 |
49.73 (0.46%) |
50.95 |
48.60 - 50.95 |
0.8598 times |
Weekly price and charts KanishkSt Strong weekly Stock price targets for KanishkSt 513456 are 48.5 and 54.27 | Weekly Target 1 | 44.29 | | Weekly Target 2 | 46.93 | | Weekly Target 3 | 50.06 | | Weekly Target 4 | 52.7 | | Weekly Target 5 | 55.83 |
Weekly price and volumes for Kanishk St
| Date |
Closing |
Open |
Range |
Volume |
Tue 21 October 2025 |
49.57 (2.44%) |
47.50 |
47.42 - 53.19 |
0.0648 times |
Fri 17 October 2025 |
48.39 (-8.65%) |
53.23 |
47.76 - 53.23 |
1.539 times |
Fri 10 October 2025 |
52.97 (9.87%) |
50.50 |
47.34 - 56.10 |
0.6172 times |
Fri 03 October 2025 |
48.21 (-3.56%) |
50.80 |
47.22 - 51.77 |
1.0781 times |
Fri 26 September 2025 |
49.99 (-0.4%) |
48.00 |
47.70 - 52.69 |
2.0278 times |
Fri 19 September 2025 |
50.19 (-5.68%) |
55.50 |
48.76 - 55.50 |
0.716 times |
Fri 12 September 2025 |
53.21 (11.5%) |
47.72 |
45.34 - 53.21 |
2.3981 times |
Fri 05 September 2025 |
47.72 (1.79%) |
48.15 |
45.10 - 49.20 |
0.3837 times |
Fri 29 August 2025 |
46.88 (-0.26%) |
48.39 |
44.05 - 48.39 |
0.5194 times |
Fri 22 August 2025 |
47.00 (0.34%) |
48.00 |
45.06 - 48.90 |
0.6559 times |
Thu 14 August 2025 |
46.84 (-0.34%) |
49.00 |
45.00 - 49.48 |
0.7486 times |

Monthly price and charts KanishkSt Strong monthly Stock price targets for KanishkSt 513456 are 43.96 and 52.84 | Monthly Target 1 | 42.08 | | Monthly Target 2 | 45.83 | | Monthly Target 3 | 50.963333333333 | | Monthly Target 4 | 54.71 | | Monthly Target 5 | 59.84 |
Monthly price and volumes Kanishk St
| Date |
Closing |
Open |
Range |
Volume |
Tue 21 October 2025 |
49.57 (1.89%) |
51.00 |
47.22 - 56.10 |
0.5267 times |
Tue 30 September 2025 |
48.65 (3.78%) |
48.15 |
45.10 - 55.50 |
1.3362 times |
Fri 29 August 2025 |
46.88 (-2.17%) |
49.50 |
44.05 - 49.50 |
0.5301 times |
Thu 31 July 2025 |
47.92 (2.07%) |
49.29 |
45.06 - 51.88 |
0.9243 times |
Mon 30 June 2025 |
46.95 (22.27%) |
37.99 |
34.70 - 50.98 |
2.9713 times |
Fri 30 May 2025 |
38.40 (5.96%) |
35.85 |
33.33 - 40.00 |
0.3385 times |
Wed 30 April 2025 |
36.24 (14.39%) |
31.68 |
31.68 - 44.00 |
1.2151 times |
Fri 28 March 2025 |
31.68 (15.24%) |
27.49 |
24.34 - 36.60 |
1.1938 times |
Fri 28 February 2025 |
27.49 (-2.03%) |
28.37 |
24.25 - 31.85 |
0.3615 times |
Fri 31 January 2025 |
28.06 (-17.18%) |
33.88 |
27.00 - 35.80 |
0.6026 times |
Tue 31 December 2024 |
33.88 (2.85%) |
33.75 |
31.30 - 35.88 |
0.3853 times |

DMA SMA EMA moving averages of Kanishk St 513456
DMA (daily moving average) of Kanishk St 513456
| DMA period | DMA value | | 5 day DMA | 49.32 | | 12 day DMA | 50.25 | | 20 day DMA | 49.86 | | 35 day DMA | 49.6 | | 50 day DMA | 48.79 | | 100 day DMA | 47.28 | | 150 day DMA | 43.07 | | 200 day DMA | 39.64 | EMA (exponential moving average) of Kanishk St 513456
| EMA period | EMA current | EMA prev | EMA prev2 | | 5 day EMA | 49.46 | 49.4 | 49.55 | | 12 day EMA | 49.76 | 49.8 | 49.93 | | 20 day EMA | 49.74 | 49.76 | 49.83 | | 35 day EMA | 49.24 | 49.22 | 49.23 | | 50 day EMA | 48.7 | 48.66 | 48.64 |
SMA (simple moving average) of Kanishk St 513456
| SMA period | SMA current | SMA prev | SMA prev2 | | 5 day SMA | 49.32 | 49.29 | 49.58 | | 12 day SMA | 50.25 | 50.13 | 50.11 | | 20 day SMA | 49.86 | 49.85 | 49.9 | | 35 day SMA | 49.6 | 49.54 | 49.47 | | 50 day SMA | 48.79 | 48.74 | 48.7 | | 100 day SMA | 47.28 | 47.16 | 47.06 | | 150 day SMA | 43.07 | 42.91 | 42.75 | | 200 day SMA | 39.64 | 39.56 | 39.49 |
|
|
