BloomIndust 513422 full analysis,charts,indicators,moving averages,SMA,DMA,EMA,ADX,MACD,RSIBloom Indust 513422 WideScreen charts, DMA,SMA,EMA technical analysis, forecast prediction, by indicators ADX,MACD,RSI,CCI BSE stock exchange
Daily price and charts and targets BloomIndust Strong Daily Stock price targets for BloomIndust 513422 are 37.53 and 44.33 | Daily Target 1 | 32.15 | | Daily Target 2 | 36.1 | | Daily Target 3 | 38.95 | | Daily Target 4 | 42.9 | | Daily Target 5 | 45.75 |
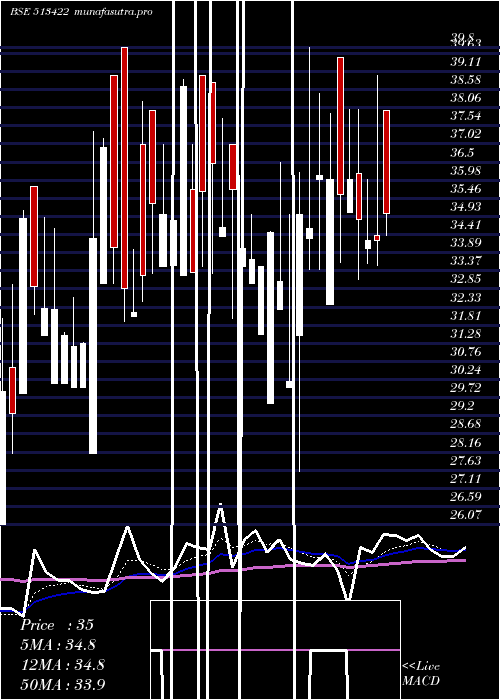
Daily price and volume Bloom Indust
| Date |
Closing |
Open |
Range |
Volume |
Tue 21 October 2025 |
40.05 (3.84%) |
35.00 |
35.00 - 41.80 |
0.1967 times |
Mon 20 October 2025 |
38.57 (1.21%) |
41.90 |
35.00 - 41.90 |
0.1508 times |
Fri 17 October 2025 |
38.11 (-6.39%) |
42.00 |
38.05 - 42.00 |
0.3789 times |
Thu 16 October 2025 |
40.71 (0.49%) |
40.71 |
40.00 - 42.00 |
6.0797 times |
Wed 15 October 2025 |
40.51 (-0.74%) |
41.89 |
38.02 - 41.89 |
0.6247 times |
Tue 14 October 2025 |
40.81 (0.89%) |
42.90 |
38.00 - 43.43 |
0.9251 times |
Mon 13 October 2025 |
40.45 (-0.1%) |
40.49 |
40.45 - 40.49 |
0.0306 times |
Fri 10 October 2025 |
40.49 (-0.95%) |
40.10 |
39.00 - 40.87 |
1.1098 times |
Thu 09 October 2025 |
40.88 (0.52%) |
40.05 |
40.05 - 41.45 |
0.2082 times |
Wed 08 October 2025 |
40.67 (-2.89%) |
41.85 |
40.00 - 41.88 |
0.2954 times |
Tue 07 October 2025 |
41.88 (0.22%) |
41.99 |
39.71 - 41.99 |
0.878 times |
Weekly price and charts BloomIndust Strong weekly Stock price targets for BloomIndust 513422 are 34.08 and 40.98 | Weekly Target 1 | 32.08 | | Weekly Target 2 | 36.07 | | Weekly Target 3 | 38.983333333333 | | Weekly Target 4 | 42.97 | | Weekly Target 5 | 45.88 |
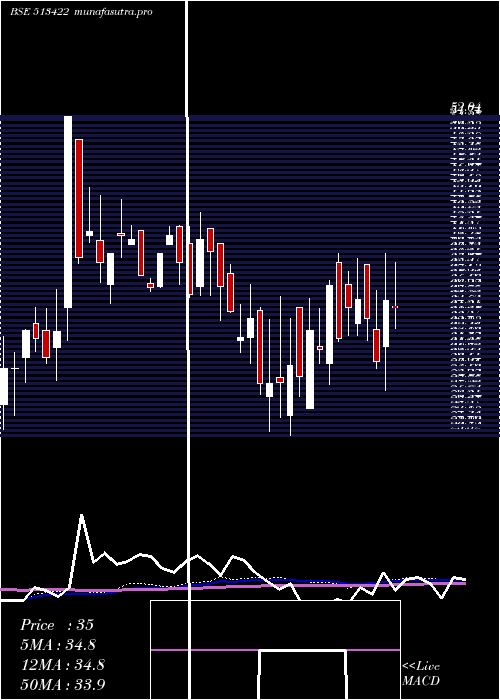
Weekly price and volumes for Bloom Indust
| Date |
Closing |
Open |
Range |
Volume |
Tue 21 October 2025 |
40.05 (5.09%) |
41.90 |
35.00 - 41.90 |
0.1181 times |
Fri 17 October 2025 |
38.11 (-5.88%) |
40.49 |
38.00 - 43.43 |
2.7328 times |
Fri 10 October 2025 |
40.49 (0.1%) |
41.90 |
39.00 - 41.99 |
0.8612 times |
Fri 03 October 2025 |
40.45 (-0.83%) |
40.99 |
38.51 - 42.69 |
0.3177 times |
Fri 26 September 2025 |
40.79 (-0.17%) |
39.01 |
38.80 - 42.68 |
0.743 times |
Fri 19 September 2025 |
40.86 (1.47%) |
38.40 |
38.40 - 44.97 |
2.0051 times |
Fri 12 September 2025 |
40.27 (-2.07%) |
40.30 |
38.53 - 42.89 |
0.6012 times |
Fri 05 September 2025 |
41.12 (1.16%) |
39.10 |
39.00 - 43.00 |
0.4701 times |
Fri 29 August 2025 |
40.65 (-7.61%) |
44.48 |
40.34 - 44.48 |
1.0011 times |
Fri 22 August 2025 |
44.00 (1.17%) |
44.99 |
40.17 - 45.30 |
1.1498 times |
Thu 14 August 2025 |
43.49 (3.38%) |
42.10 |
42.10 - 47.90 |
0.6838 times |
Monthly price and charts BloomIndust Strong monthly Stock price targets for BloomIndust 513422 are 33.31 and 41.74 | Monthly Target 1 | 31.06 | | Monthly Target 2 | 35.56 | | Monthly Target 3 | 39.493333333333 | | Monthly Target 4 | 43.99 | | Monthly Target 5 | 47.92 |
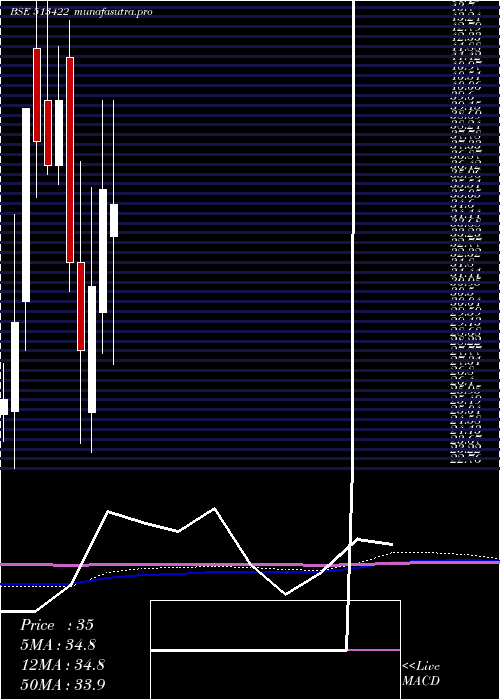
Monthly price and volumes Bloom Indust
| Date |
Closing |
Open |
Range |
Volume |
Tue 21 October 2025 |
40.05 (-1.09%) |
41.50 |
35.00 - 43.43 |
0.7183 times |
Tue 30 September 2025 |
40.49 (-0.39%) |
39.10 |
38.40 - 44.97 |
0.7769 times |
Fri 29 August 2025 |
40.65 (-5%) |
43.85 |
38.00 - 47.90 |
1.053 times |
Thu 31 July 2025 |
42.79 (6.84%) |
40.25 |
33.60 - 43.96 |
2.3547 times |
Mon 30 June 2025 |
40.05 (10.51%) |
34.01 |
32.15 - 45.00 |
1.4409 times |
Fri 30 May 2025 |
36.24 (1.48%) |
33.50 |
27.60 - 39.80 |
0.2868 times |
Wed 30 April 2025 |
35.71 (14.46%) |
30.00 |
28.10 - 39.80 |
0.4874 times |
Fri 28 March 2025 |
31.20 (10.4%) |
25.36 |
23.52 - 35.80 |
0.7412 times |
Fri 28 February 2025 |
28.26 (-12.56%) |
32.32 |
23.95 - 37.00 |
1.0814 times |
Fri 31 January 2025 |
32.32 (-18.88%) |
41.80 |
30.95 - 43.51 |
1.0594 times |
Tue 31 December 2024 |
39.84 (8.26%) |
36.82 |
35.91 - 42.32 |
0.891 times |
DMA SMA EMA moving averages of Bloom Indust 513422
DMA (daily moving average) of Bloom Indust 513422
| DMA period | DMA value | | 5 day DMA | 39.59 | | 12 day DMA | 40.41 | | 20 day DMA | 40.67 | | 35 day DMA | 40.89 | | 50 day DMA | 41.49 | | 100 day DMA | 39.6 | | 150 day DMA | 37.53 | | 200 day DMA | 36.79 | EMA (exponential moving average) of Bloom Indust 513422
| EMA period | EMA current | EMA prev | EMA prev2 | | 5 day EMA | 39.62 | 39.41 | 39.83 | | 12 day EMA | 40.13 | 40.14 | 40.43 | | 20 day EMA | 40.48 | 40.52 | 40.72 | | 35 day EMA | 40.94 | 40.99 | 41.13 | | 50 day EMA | 41.29 | 41.34 | 41.45 |
SMA (simple moving average) of Bloom Indust 513422
| SMA period | SMA current | SMA prev | SMA prev2 | | 5 day SMA | 39.59 | 39.74 | 40.12 | | 12 day SMA | 40.41 | 40.44 | 40.77 | | 20 day SMA | 40.67 | 40.73 | 40.84 | | 35 day SMA | 40.89 | 40.93 | 40.99 | | 50 day SMA | 41.49 | 41.55 | 41.62 | | 100 day SMA | 39.6 | 39.56 | 39.52 | | 150 day SMA | 37.53 | 37.47 | 37.43 | | 200 day SMA | 36.79 | 36.79 | 36.79 |
|
|
