ManInd 513269 full analysis,charts,indicators,moving averages,SMA,DMA,EMA,ADX,MACD,RSIMan Ind 513269 WideScreen charts, DMA,SMA,EMA technical analysis, forecast prediction, by indicators ADX,MACD,RSI,CCI BSE stock exchange
Daily price and charts and targets ManInd Strong Daily Stock price targets for ManInd 513269 are 437.98 and 450.33 | Daily Target 1 | 428.08 | | Daily Target 2 | 435.52 | | Daily Target 3 | 440.43333333333 | | Daily Target 4 | 447.87 | | Daily Target 5 | 452.78 |
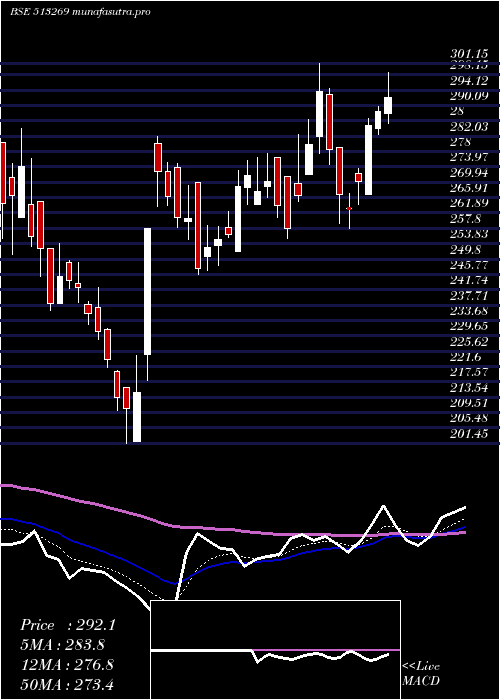
Daily price and volume Man Ind
| Date |
Closing |
Open |
Range |
Volume |
Fri 05 December 2025 |
442.95 (0.7%) |
433.00 |
433.00 - 445.35 |
0.3955 times |
Thu 04 December 2025 |
439.85 (-2.37%) |
448.30 |
436.10 - 449.95 |
0.4457 times |
Wed 03 December 2025 |
450.55 (0.46%) |
448.60 |
443.15 - 451.95 |
0.2198 times |
Tue 02 December 2025 |
448.50 (-1.99%) |
457.60 |
443.60 - 458.10 |
2.1116 times |
Mon 01 December 2025 |
457.60 (-1.91%) |
473.80 |
456.00 - 473.80 |
0.9244 times |
Fri 28 November 2025 |
466.50 (-1.27%) |
472.45 |
465.40 - 474.35 |
0.3879 times |
Thu 27 November 2025 |
472.50 (-2.42%) |
488.30 |
466.95 - 488.30 |
0.8152 times |
Wed 26 November 2025 |
484.20 (2.81%) |
478.90 |
470.35 - 490.90 |
1.5182 times |
Tue 25 November 2025 |
470.95 (0.77%) |
479.00 |
460.15 - 479.00 |
1.3997 times |
Mon 24 November 2025 |
467.35 (3.91%) |
449.95 |
449.60 - 470.50 |
1.7819 times |
Fri 21 November 2025 |
449.75 (-3.15%) |
463.65 |
448.80 - 463.65 |
1.1257 times |
Weekly price and charts ManInd Strong weekly Stock price targets for ManInd 513269 are 417.58 and 458.38 | Weekly Target 1 | 409.12 | | Weekly Target 2 | 426.03 | | Weekly Target 3 | 449.91666666667 | | Weekly Target 4 | 466.83 | | Weekly Target 5 | 490.72 |
Weekly price and volumes for Man Ind
| Date |
Closing |
Open |
Range |
Volume |
Fri 05 December 2025 |
442.95 (-5.05%) |
473.80 |
433.00 - 473.80 |
0.4595 times |
Fri 28 November 2025 |
466.50 (3.72%) |
449.95 |
449.60 - 490.90 |
0.662 times |
Fri 21 November 2025 |
449.75 (5.48%) |
435.45 |
423.00 - 472.30 |
0.9098 times |
Fri 14 November 2025 |
426.40 (11.13%) |
370.50 |
370.50 - 440.50 |
1.3283 times |
Fri 07 November 2025 |
383.70 (-7.02%) |
400.10 |
369.70 - 410.50 |
0.1697 times |
Fri 31 October 2025 |
412.65 (1.19%) |
405.45 |
400.00 - 423.10 |
0.202 times |
Thu 23 October 2025 |
407.80 (2.53%) |
407.95 |
394.45 - 413.50 |
0.143 times |
Fri 17 October 2025 |
397.75 (3.85%) |
380.00 |
360.45 - 412.70 |
0.9451 times |
Fri 10 October 2025 |
383.00 (2.08%) |
384.35 |
367.80 - 392.95 |
0.5322 times |
Fri 03 October 2025 |
375.20 (-9.85%) |
401.15 |
340.90 - 421.85 |
4.6484 times |
Fri 26 September 2025 |
416.20 (-6.16%) |
431.30 |
410.65 - 458.40 |
0.5972 times |

Monthly price and charts ManInd Strong monthly Stock price targets for ManInd 513269 are 417.58 and 458.38 | Monthly Target 1 | 409.12 | | Monthly Target 2 | 426.03 | | Monthly Target 3 | 449.91666666667 | | Monthly Target 4 | 466.83 | | Monthly Target 5 | 490.72 |
Monthly price and volumes Man Ind
| Date |
Closing |
Open |
Range |
Volume |
Fri 05 December 2025 |
442.95 (-5.05%) |
473.80 |
433.00 - 473.80 |
0.1102 times |
Fri 28 November 2025 |
466.50 (13.05%) |
400.10 |
369.70 - 490.90 |
0.7366 times |
Fri 31 October 2025 |
412.65 (13.6%) |
369.45 |
356.90 - 423.10 |
0.5819 times |
Tue 30 September 2025 |
363.25 (-5.12%) |
381.75 |
340.90 - 458.40 |
1.7073 times |
Fri 29 August 2025 |
382.85 (-14.47%) |
433.15 |
379.85 - 458.50 |
0.7993 times |
Thu 31 July 2025 |
447.60 (8.36%) |
419.25 |
406.15 - 469.00 |
0.9069 times |
Mon 30 June 2025 |
413.05 (10%) |
379.00 |
361.00 - 419.00 |
1.7203 times |
Fri 30 May 2025 |
375.50 (37.7%) |
270.30 |
250.00 - 378.60 |
1.6946 times |
Wed 30 April 2025 |
272.70 (2.31%) |
272.05 |
257.90 - 301.15 |
0.6663 times |
Fri 28 March 2025 |
266.55 (24.85%) |
216.00 |
201.45 - 282.40 |
1.0766 times |
Fri 28 February 2025 |
213.50 (-26.47%) |
282.00 |
210.05 - 292.00 |
0.3962 times |

DMA SMA EMA moving averages of Man Ind 513269
DMA (daily moving average) of Man Ind 513269
| DMA period | DMA value | | 5 day DMA | 447.89 | | 12 day DMA | 459.59 | | 20 day DMA | 436.5 | | 35 day DMA | 421.62 | | 50 day DMA | 414.01 | | 100 day DMA | 416.5 | | 150 day DMA | 398.21 | | 200 day DMA | 364.44 | EMA (exponential moving average) of Man Ind 513269
| EMA period | EMA current | EMA prev | EMA prev2 | | 5 day EMA | 448.14 | 450.73 | 456.17 | | 12 day EMA | 448.24 | 449.2 | 450.9 | | 20 day EMA | 441.06 | 440.86 | 440.97 | | 35 day EMA | 430.58 | 429.85 | 429.26 | | 50 day EMA | 418.29 | 417.28 | 416.36 |
SMA (simple moving average) of Man Ind 513269
| SMA period | SMA current | SMA prev | SMA prev2 | | 5 day SMA | 447.89 | 452.6 | 459.13 | | 12 day SMA | 459.59 | 460.19 | 458.97 | | 20 day SMA | 436.5 | 433.34 | 431.03 | | 35 day SMA | 421.62 | 419.69 | 418.07 | | 50 day SMA | 414.01 | 414.02 | 413.83 | | 100 day SMA | 416.5 | 416.31 | 416.15 | | 150 day SMA | 398.21 | 397.07 | 395.95 | | 200 day SMA | 364.44 | 363.59 | 362.84 |
|
|
