GS 513059 full analysis,charts,indicators,moving averages,SMA,DMA,EMA,ADX,MACD,RSIG S 513059 WideScreen charts, DMA,SMA,EMA technical analysis, forecast prediction, by indicators ADX,MACD,RSI,CCI BSE stock exchange
Daily price and charts and targets GS Strong Daily Stock price targets for GS 513059 are 33.87 and 34.87 | Daily Target 1 | 33.54 | | Daily Target 2 | 34.19 | | Daily Target 3 | 34.543333333333 | | Daily Target 4 | 35.19 | | Daily Target 5 | 35.54 |
Daily price and volume G S
| Date |
Closing |
Open |
Range |
Volume |
Tue 21 October 2025 |
34.83 (1.75%) |
34.90 |
33.90 - 34.90 |
0.448 times |
Mon 20 October 2025 |
34.23 (2%) |
34.25 |
33.30 - 34.90 |
0.961 times |
Fri 17 October 2025 |
33.56 (-0.15%) |
33.61 |
33.50 - 34.65 |
0.8225 times |
Thu 16 October 2025 |
33.61 (-0.65%) |
34.95 |
33.57 - 34.95 |
0.381 times |
Wed 15 October 2025 |
33.83 (-0.94%) |
34.15 |
33.70 - 34.99 |
0.2546 times |
Tue 14 October 2025 |
34.15 (-0.29%) |
34.89 |
33.50 - 34.89 |
0.3937 times |
Mon 13 October 2025 |
34.25 (0.41%) |
34.11 |
33.01 - 34.68 |
0.9602 times |
Fri 10 October 2025 |
34.11 (-0.09%) |
35.70 |
33.76 - 35.70 |
1.0655 times |
Thu 09 October 2025 |
34.14 (1.04%) |
35.90 |
33.00 - 36.09 |
3.6347 times |
Wed 08 October 2025 |
33.79 (-4.68%) |
35.45 |
33.60 - 35.45 |
1.0788 times |
Tue 07 October 2025 |
35.45 (2.46%) |
34.21 |
34.21 - 35.70 |
0.3539 times |
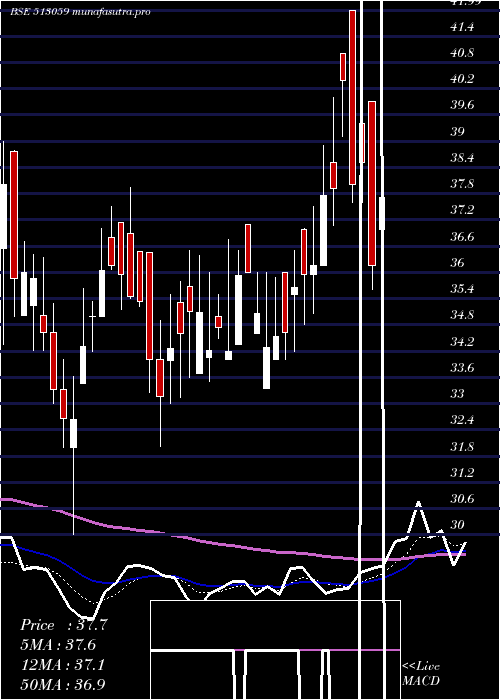
Weekly price and charts GS Strong weekly Stock price targets for GS 513059 are 34.07 and 35.67 | Weekly Target 1 | 32.74 | | Weekly Target 2 | 33.79 | | Weekly Target 3 | 34.343333333333 | | Weekly Target 4 | 35.39 | | Weekly Target 5 | 35.94 |
Weekly price and volumes for G S
| Date |
Closing |
Open |
Range |
Volume |
Tue 21 October 2025 |
34.83 (3.78%) |
34.25 |
33.30 - 34.90 |
0.2668 times |
Fri 17 October 2025 |
33.56 (-1.61%) |
34.11 |
33.01 - 34.99 |
0.5324 times |
Fri 10 October 2025 |
34.11 (-1.95%) |
35.69 |
33.00 - 37.00 |
1.5306 times |
Fri 03 October 2025 |
34.79 (2.38%) |
33.05 |
33.05 - 35.99 |
1.3568 times |
Fri 26 September 2025 |
33.98 (0.5%) |
34.20 |
33.10 - 35.35 |
1.6392 times |
Fri 19 September 2025 |
33.81 (-1.97%) |
35.00 |
33.46 - 36.45 |
1.392 times |
Fri 12 September 2025 |
34.49 (0.12%) |
35.00 |
32.00 - 35.00 |
1.0317 times |
Fri 05 September 2025 |
34.45 (2.1%) |
33.15 |
33.00 - 35.94 |
0.6508 times |
Fri 29 August 2025 |
33.74 (-2.65%) |
34.95 |
33.00 - 36.00 |
0.2941 times |
Fri 22 August 2025 |
34.66 (8.69%) |
31.01 |
31.01 - 35.50 |
1.3056 times |
Thu 14 August 2025 |
31.89 (-3.36%) |
32.05 |
31.60 - 34.18 |
0.5462 times |
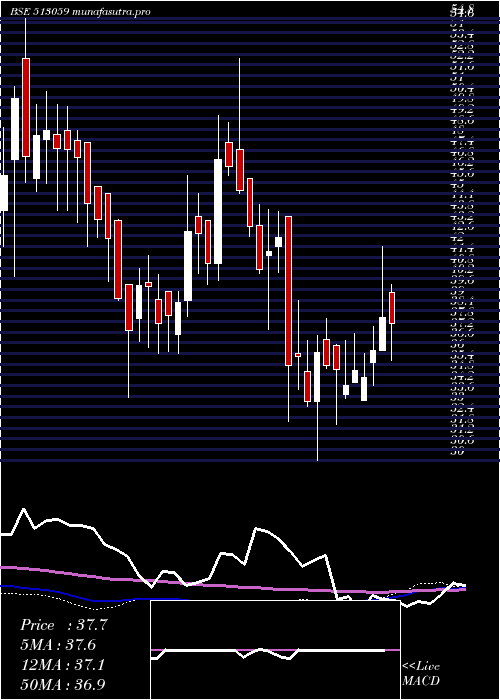
Monthly price and charts GS Strong monthly Stock price targets for GS 513059 are 31.92 and 35.92 | Monthly Target 1 | 30.94 | | Monthly Target 2 | 32.89 | | Monthly Target 3 | 34.943333333333 | | Monthly Target 4 | 36.89 | | Monthly Target 5 | 38.94 |
Monthly price and volumes G S
| Date |
Closing |
Open |
Range |
Volume |
Tue 21 October 2025 |
34.83 (0.26%) |
35.40 |
33.00 - 37.00 |
0.6107 times |
Tue 30 September 2025 |
34.74 (2.96%) |
33.15 |
32.00 - 36.45 |
1.0139 times |
Fri 29 August 2025 |
33.74 (5.21%) |
32.20 |
31.01 - 36.00 |
0.6026 times |
Thu 31 July 2025 |
32.07 (-9.36%) |
36.45 |
31.20 - 37.20 |
0.8261 times |
Mon 30 June 2025 |
35.38 (-3.86%) |
35.21 |
33.70 - 37.74 |
1.0863 times |
Fri 30 May 2025 |
36.80 (-2.39%) |
38.40 |
34.99 - 39.75 |
0.9057 times |
Wed 30 April 2025 |
37.70 (10.3%) |
34.35 |
33.35 - 41.99 |
0.493 times |
Fri 28 March 2025 |
34.18 (2.61%) |
33.31 |
30.00 - 37.95 |
0.8117 times |
Fri 28 February 2025 |
33.31 (-20.18%) |
42.00 |
32.16 - 43.99 |
1.0246 times |
Fri 31 January 2025 |
41.73 (-9.91%) |
47.50 |
37.36 - 52.55 |
2.6254 times |
Tue 31 December 2024 |
46.32 (19.26%) |
39.00 |
38.05 - 49.38 |
2.424 times |

DMA SMA EMA moving averages of G S 513059
DMA (daily moving average) of G S 513059
| DMA period | DMA value | | 5 day DMA | 34.01 | | 12 day DMA | 34.21 | | 20 day DMA | 34.21 | | 35 day DMA | 34.22 | | 50 day DMA | 33.99 | | 100 day DMA | 34.57 | | 150 day DMA | 35.18 | | 200 day DMA | 36.59 | EMA (exponential moving average) of G S 513059
| EMA period | EMA current | EMA prev | EMA prev2 | | 5 day EMA | 34.24 | 33.95 | 33.81 | | 12 day EMA | 34.19 | 34.07 | 34.04 | | 20 day EMA | 34.16 | 34.09 | 34.08 | | 35 day EMA | 34.05 | 34 | 33.99 | | 50 day EMA | 33.9 | 33.86 | 33.84 |
SMA (simple moving average) of G S 513059
| SMA period | SMA current | SMA prev | SMA prev2 | | 5 day SMA | 34.01 | 33.88 | 33.88 | | 12 day SMA | 34.21 | 34.21 | 34.27 | | 20 day SMA | 34.21 | 34.16 | 34.14 | | 35 day SMA | 34.22 | 34.19 | 34.18 | | 50 day SMA | 33.99 | 33.96 | 33.94 | | 100 day SMA | 34.57 | 34.6 | 34.63 | | 150 day SMA | 35.18 | 35.18 | 35.16 | | 200 day SMA | 36.59 | 36.62 | 36.66 |
|
|
