VbcFerro 513005 full analysis,charts,indicators,moving averages,SMA,DMA,EMA,ADX,MACD,RSIVbc Ferro 513005 WideScreen charts, DMA,SMA,EMA technical analysis, forecast prediction, by indicators ADX,MACD,RSI,CCI BSE stock exchange
Daily price and charts and targets VbcFerro Strong Daily Stock price targets for VbcFerro 513005 are 45.11 and 49.41 | Daily Target 1 | 41.87 | | Daily Target 2 | 44.05 | | Daily Target 3 | 46.173333333333 | | Daily Target 4 | 48.35 | | Daily Target 5 | 50.47 |
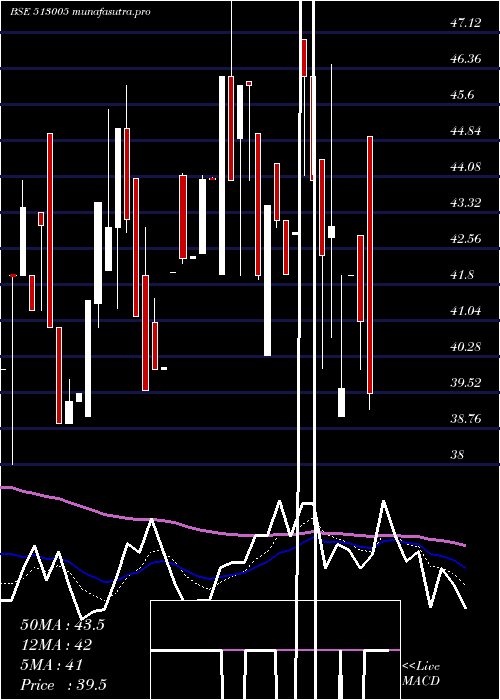
Daily price and volume Vbc Ferro
| Date |
Closing |
Open |
Range |
Volume |
Tue 21 October 2025 |
46.22 (-2.49%) |
44.13 |
44.00 - 48.30 |
0.7885 times |
Mon 20 October 2025 |
47.40 (2.51%) |
48.89 |
46.24 - 48.89 |
0.6691 times |
Fri 17 October 2025 |
46.24 (-4.78%) |
49.99 |
46.20 - 49.99 |
0.345 times |
Thu 16 October 2025 |
48.56 (4.07%) |
46.50 |
46.05 - 48.80 |
1.0577 times |
Wed 15 October 2025 |
46.66 (-2.28%) |
46.50 |
45.50 - 48.70 |
0.3211 times |
Tue 14 October 2025 |
47.75 (3%) |
45.53 |
45.53 - 49.50 |
2.5273 times |
Mon 13 October 2025 |
46.36 (-6.02%) |
49.00 |
45.51 - 51.50 |
2.895 times |
Fri 10 October 2025 |
49.33 (4.85%) |
48.50 |
46.12 - 52.00 |
1.1341 times |
Thu 09 October 2025 |
47.05 (-3.92%) |
48.94 |
46.60 - 48.94 |
0.1283 times |
Wed 08 October 2025 |
48.97 (6.11%) |
46.11 |
46.11 - 50.00 |
0.1337 times |
Tue 07 October 2025 |
46.15 (-0.32%) |
50.00 |
46.10 - 50.00 |
0.3635 times |
Weekly price and charts VbcFerro Strong weekly Stock price targets for VbcFerro 513005 are 42.67 and 47.56 | Weekly Target 1 | 41.48 | | Weekly Target 2 | 43.85 | | Weekly Target 3 | 46.37 | | Weekly Target 4 | 48.74 | | Weekly Target 5 | 51.26 |
Weekly price and volumes for Vbc Ferro
| Date |
Closing |
Open |
Range |
Volume |
Tue 21 October 2025 |
46.22 (-0.04%) |
48.89 |
44.00 - 48.89 |
0.2118 times |
Fri 17 October 2025 |
46.24 (-6.26%) |
49.00 |
45.50 - 51.50 |
1.0383 times |
Fri 10 October 2025 |
49.33 (2.79%) |
47.99 |
46.00 - 52.00 |
0.3021 times |
Fri 03 October 2025 |
47.99 (5.47%) |
46.45 |
41.05 - 51.00 |
0.7767 times |
Fri 26 September 2025 |
45.50 (-7.1%) |
50.20 |
45.00 - 52.00 |
0.5668 times |
Fri 19 September 2025 |
48.98 (2.75%) |
47.00 |
43.50 - 54.99 |
1.3234 times |
Fri 12 September 2025 |
47.67 (-2.3%) |
51.00 |
45.28 - 51.50 |
1.408 times |
Fri 05 September 2025 |
48.79 (1.75%) |
48.91 |
41.50 - 51.80 |
1.5143 times |
Fri 29 August 2025 |
47.95 (3.77%) |
46.90 |
42.21 - 54.00 |
1.0487 times |
Fri 22 August 2025 |
46.21 (-1.7%) |
47.95 |
44.51 - 52.99 |
1.8099 times |
Thu 14 August 2025 |
47.01 (1.42%) |
47.52 |
44.01 - 52.99 |
0.1619 times |

Monthly price and charts VbcFerro Strong monthly Stock price targets for VbcFerro 513005 are 41.11 and 49.11 | Monthly Target 1 | 39.41 | | Monthly Target 2 | 42.81 | | Monthly Target 3 | 47.406666666667 | | Monthly Target 4 | 50.81 | | Monthly Target 5 | 55.41 |
Monthly price and volumes Vbc Ferro
| Date |
Closing |
Open |
Range |
Volume |
Tue 21 October 2025 |
46.22 (-3.69%) |
50.00 |
44.00 - 52.00 |
0.572 times |
Tue 30 September 2025 |
47.99 (0.08%) |
48.91 |
41.05 - 54.99 |
1.3268 times |
Fri 29 August 2025 |
47.95 (-2.9%) |
49.38 |
42.21 - 58.00 |
0.8723 times |
Thu 31 July 2025 |
49.38 (26.29%) |
39.50 |
39.10 - 57.00 |
2.1904 times |
Mon 30 June 2025 |
39.10 (-14.03%) |
46.39 |
37.15 - 46.39 |
1.3949 times |
Fri 30 May 2025 |
45.48 (15.14%) |
43.40 |
39.52 - 50.80 |
0.7649 times |
Wed 30 April 2025 |
39.50 (-10.23%) |
44.88 |
39.01 - 46.98 |
0.203 times |
Fri 28 March 2025 |
44.00 (13.23%) |
38.86 |
38.86 - 48.00 |
1.0257 times |
Fri 28 February 2025 |
38.86 (-13.22%) |
40.86 |
38.00 - 48.66 |
0.6671 times |
Fri 31 January 2025 |
44.78 (-21.63%) |
56.00 |
44.70 - 59.95 |
0.9829 times |
Tue 31 December 2024 |
57.14 (41.37%) |
39.10 |
38.50 - 64.44 |
6.9631 times |

DMA SMA EMA moving averages of Vbc Ferro 513005
DMA (daily moving average) of Vbc Ferro 513005
| DMA period | DMA value | | 5 day DMA | 47.02 | | 12 day DMA | 47.25 | | 20 day DMA | 47.41 | | 35 day DMA | 47.45 | | 50 day DMA | 47.28 | | 100 day DMA | 45.78 | | 150 day DMA | 45.02 | | 200 day DMA | 46.16 | EMA (exponential moving average) of Vbc Ferro 513005
| EMA period | EMA current | EMA prev | EMA prev2 | | 5 day EMA | 46.92 | 47.27 | 47.21 | | 12 day EMA | 47.21 | 47.39 | 47.39 | | 20 day EMA | 47.31 | 47.43 | 47.43 | | 35 day EMA | 47.32 | 47.39 | 47.39 | | 50 day EMA | 47.3 | 47.34 | 47.34 |
SMA (simple moving average) of Vbc Ferro 513005
| SMA period | SMA current | SMA prev | SMA prev2 | | 5 day SMA | 47.02 | 47.32 | 47.11 | | 12 day SMA | 47.25 | 47.4 | 47.54 | | 20 day SMA | 47.41 | 47.55 | 47.63 | | 35 day SMA | 47.45 | 47.42 | 47.44 | | 50 day SMA | 47.28 | 47.28 | 47.27 | | 100 day SMA | 45.78 | 45.76 | 45.74 | | 150 day SMA | 45.02 | 44.97 | 44.92 | | 200 day SMA | 46.16 | 46.21 | 46.23 |
|
|
