ZenithExp 512553 full analysis,charts,indicators,moving averages,SMA,DMA,EMA,ADX,MACD,RSIZenith Exp 512553 WideScreen charts, DMA,SMA,EMA technical analysis, forecast prediction, by indicators ADX,MACD,RSI,CCI BSE stock exchange
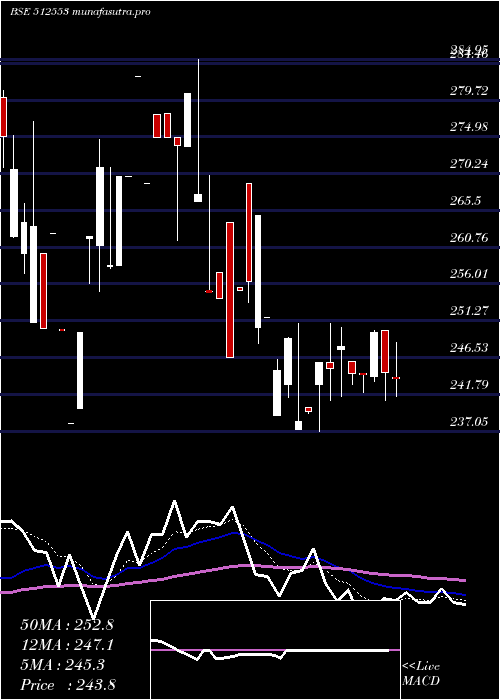
Daily price and charts and targets ZenithExp Strong Daily Stock price targets for ZenithExp 512553 are 246.6 and 253.15 | Daily Target 1 | 241.18 | | Daily Target 2 | 245.47 | | Daily Target 3 | 247.73333333333 | | Daily Target 4 | 252.02 | | Daily Target 5 | 254.28 |
Daily price and volume Zenith Exp
| Date |
Closing |
Open |
Range |
Volume |
Fri 11 July 2025 |
249.75 (2.21%) |
244.05 |
243.45 - 250.00 |
1.1902 times |
Thu 10 July 2025 |
244.35 (-0.06%) |
244.50 |
242.05 - 244.50 |
0.1825 times |
Wed 09 July 2025 |
244.50 (-1.41%) |
246.00 |
243.05 - 246.00 |
0.5851 times |
Tue 08 July 2025 |
248.00 (1.16%) |
247.60 |
241.55 - 250.45 |
2.2019 times |
Mon 07 July 2025 |
245.15 (-0.31%) |
245.95 |
241.00 - 250.90 |
2.8862 times |
Fri 04 July 2025 |
245.90 (2.65%) |
243.00 |
237.05 - 245.90 |
0.2649 times |
Thu 03 July 2025 |
239.55 (0.5%) |
240.05 |
239.35 - 240.05 |
0.084 times |
Wed 02 July 2025 |
238.35 (-4.3%) |
237.20 |
237.20 - 250.95 |
0.08 times |
Tue 01 July 2025 |
249.05 (1.74%) |
243.05 |
241.40 - 249.10 |
2.0498 times |
Mon 30 June 2025 |
244.80 (-2.72%) |
239.10 |
239.10 - 246.35 |
0.4754 times |
Fri 27 June 2025 |
251.65 (-4.98%) |
251.65 |
251.65 - 251.65 |
0.0016 times |
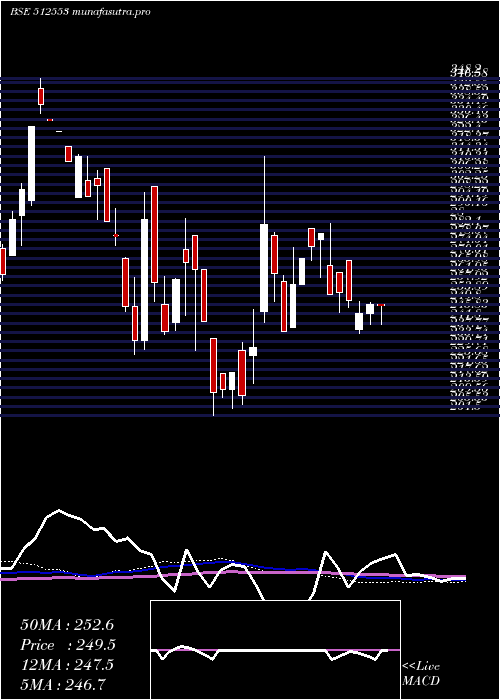
Weekly price and charts ZenithExp Strong weekly Stock price targets for ZenithExp 512553 are 245.38 and 255.28 | Weekly Target 1 | 237.32 | | Weekly Target 2 | 243.53 | | Weekly Target 3 | 247.21666666667 | | Weekly Target 4 | 253.43 | | Weekly Target 5 | 257.12 |
Weekly price and volumes for Zenith Exp
| Date |
Closing |
Open |
Range |
Volume |
Fri 11 July 2025 |
249.75 (1.57%) |
245.95 |
241.00 - 250.90 |
5.7304 times |
Fri 04 July 2025 |
245.90 (-2.28%) |
239.10 |
237.05 - 250.95 |
2.4027 times |
Fri 27 June 2025 |
251.65 (-1.37%) |
269.00 |
248.40 - 269.00 |
0.0234 times |
Wed 18 June 2025 |
255.15 (0.39%) |
263.95 |
246.55 - 263.95 |
0.4264 times |
Thu 12 June 2025 |
254.15 (-9.43%) |
266.60 |
254.15 - 284.95 |
0.5221 times |
Wed 04 June 2025 |
280.60 (2.05%) |
278.00 |
261.60 - 280.60 |
0.1953 times |
Fri 30 May 2025 |
274.95 (1.89%) |
282.80 |
269.00 - 282.80 |
0.2949 times |
Tue 20 May 2025 |
269.85 (4.43%) |
258.40 |
258.40 - 269.90 |
0.0065 times |
Fri 16 May 2025 |
258.40 (8.57%) |
240.00 |
240.00 - 274.60 |
0.3014 times |
Thu 08 May 2025 |
238.00 (-9.64%) |
260.00 |
238.00 - 262.50 |
0.097 times |
Fri 02 May 2025 |
263.40 (-7.42%) |
280.00 |
251.00 - 281.00 |
0.4251 times |
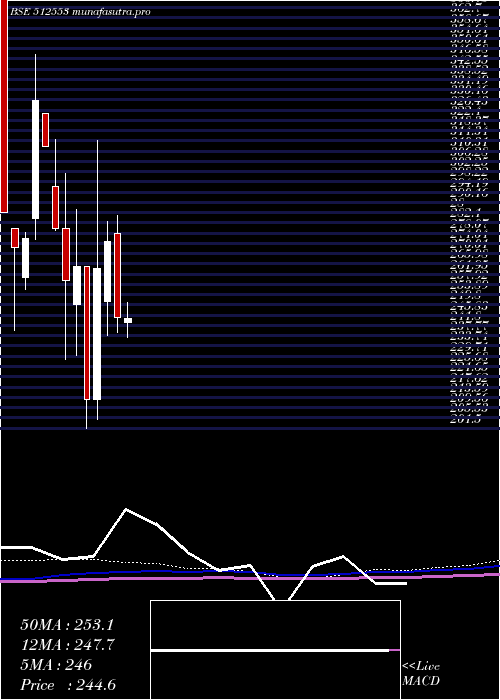
Monthly price and charts ZenithExp Strong monthly Stock price targets for ZenithExp 512553 are 243.4 and 257.3 | Monthly Target 1 | 232.02 | | Monthly Target 2 | 240.88 | | Monthly Target 3 | 245.91666666667 | | Monthly Target 4 | 254.78 | | Monthly Target 5 | 259.82 |
Monthly price and volumes Zenith Exp
| Date |
Closing |
Open |
Range |
Volume |
Fri 11 July 2025 |
249.75 (2.02%) |
243.05 |
237.05 - 250.95 |
2.0711 times |
Mon 30 June 2025 |
244.80 (-10.97%) |
278.00 |
239.10 - 284.95 |
0.4154 times |
Fri 30 May 2025 |
274.95 (4.15%) |
251.05 |
238.00 - 282.80 |
0.1977 times |
Wed 30 April 2025 |
264.00 (24%) |
212.90 |
204.70 - 314.30 |
4.1933 times |
Fri 28 March 2025 |
212.90 (-19.63%) |
264.90 |
201.50 - 264.90 |
0.1011 times |
Fri 28 February 2025 |
264.90 (2.08%) |
250.00 |
229.85 - 287.25 |
1.4644 times |
Fri 31 January 2025 |
259.50 (-7.24%) |
279.75 |
228.25 - 301.35 |
0.6245 times |
Tue 31 December 2024 |
279.75 (-10.38%) |
296.55 |
279.25 - 315.00 |
0.3963 times |
Thu 28 November 2024 |
312.15 (-5.41%) |
325.00 |
312.15 - 325.00 |
0.1559 times |
Thu 31 October 2024 |
330.00 (19.63%) |
284.00 |
275.60 - 348.20 |
0.3803 times |
Mon 30 September 2024 |
275.85 (1.23%) |
260.60 |
256.10 - 278.25 |
0.6074 times |
DMA SMA EMA moving averages of Zenith Exp 512553
DMA (daily moving average) of Zenith Exp 512553
| DMA period | DMA value | | 5 day DMA | 246.35 | | 12 day DMA | 247.16 | | 20 day DMA | 252.76 | | 35 day DMA | 257.2 | | 50 day DMA | 253.32 | | 100 day DMA | 252.57 | | 150 day DMA | 267.9 | | 200 day DMA | 275.18 | EMA (exponential moving average) of Zenith Exp 512553
| EMA period | EMA current | EMA prev | EMA prev2 | | 5 day EMA | 246.68 | 245.14 | 245.53 | | 12 day EMA | 248.28 | 248.01 | 248.67 | | 20 day EMA | 250.46 | 250.54 | 251.19 | | 35 day EMA | 249.58 | 249.57 | 249.88 | | 50 day EMA | 249.38 | 249.36 | 249.56 |
SMA (simple moving average) of Zenith Exp 512553
| SMA period | SMA current | SMA prev | SMA prev2 | | 5 day SMA | 246.35 | 245.58 | 244.62 | | 12 day SMA | 247.16 | 247.71 | 248.61 | | 20 day SMA | 252.76 | 254.02 | 255.55 | | 35 day SMA | 257.2 | 257.61 | 258.36 | | 50 day SMA | 253.32 | 252.58 | 251.96 | | 100 day SMA | 252.57 | 252.87 | 253.29 | | 150 day SMA | 267.9 | 268.05 | 268.27 | | 200 day SMA | 275.18 | 276.01 | 276.9 |
|
|
