GarnetIntl 512493 full analysis,charts,indicators,moving averages,SMA,DMA,EMA,ADX,MACD,RSIGarnet Intl 512493 WideScreen charts, DMA,SMA,EMA technical analysis, forecast prediction, by indicators ADX,MACD,RSI,CCI BSE stock exchange
Daily price and charts and targets GarnetIntl Strong Daily Stock price targets for GarnetIntl 512493 are 73.08 and 75.66 | Daily Target 1 | 70.93 | | Daily Target 2 | 72.64 | | Daily Target 3 | 73.51 | | Daily Target 4 | 75.22 | | Daily Target 5 | 76.09 |
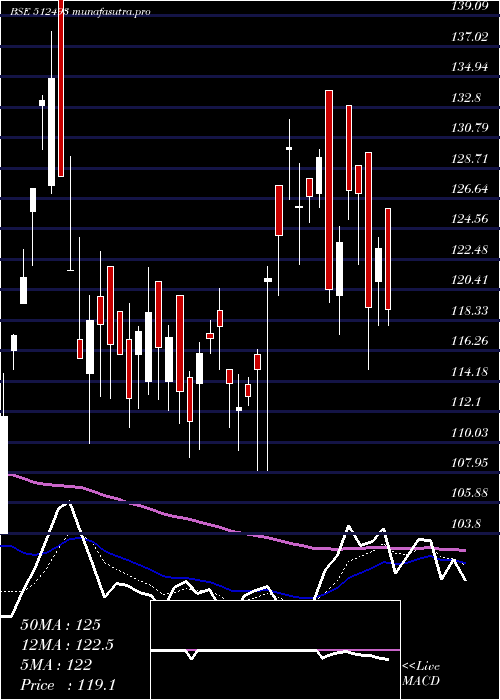
Daily price and volume Garnet Intl
| Date |
Closing |
Open |
Range |
Volume |
Fri 05 December 2025 |
74.35 (1.85%) |
73.49 |
71.80 - 74.38 |
2.9972 times |
Thu 04 December 2025 |
73.00 (-1.66%) |
74.80 |
72.51 - 74.80 |
0.2062 times |
Wed 03 December 2025 |
74.23 (-1.29%) |
75.15 |
73.03 - 75.15 |
0.1474 times |
Tue 02 December 2025 |
75.20 (-5.98%) |
77.52 |
74.02 - 78.05 |
1.2408 times |
Mon 01 December 2025 |
79.98 (1.5%) |
80.50 |
77.51 - 80.50 |
0.0555 times |
Fri 28 November 2025 |
78.80 (-3.08%) |
81.30 |
75.10 - 82.35 |
1.1948 times |
Thu 27 November 2025 |
81.30 (6.14%) |
73.15 |
73.15 - 82.80 |
1.1026 times |
Wed 26 November 2025 |
76.60 (7.51%) |
68.75 |
68.75 - 78.00 |
1.1715 times |
Tue 25 November 2025 |
71.25 (-0.97%) |
71.95 |
65.00 - 71.95 |
1.0059 times |
Mon 24 November 2025 |
71.95 (-4.13%) |
75.00 |
69.20 - 75.00 |
0.8781 times |
Fri 21 November 2025 |
75.05 (-1.51%) |
74.15 |
73.20 - 76.75 |
28.943 times |
Weekly price and charts GarnetIntl Strong weekly Stock price targets for GarnetIntl 512493 are 68.73 and 77.43 | Weekly Target 1 | 66.85 | | Weekly Target 2 | 70.6 | | Weekly Target 3 | 75.55 | | Weekly Target 4 | 79.3 | | Weekly Target 5 | 84.25 |
Weekly price and volumes for Garnet Intl
| Date |
Closing |
Open |
Range |
Volume |
Fri 05 December 2025 |
74.35 (-5.65%) |
80.50 |
71.80 - 80.50 |
0.4297 times |
Fri 28 November 2025 |
78.80 (5%) |
75.00 |
65.00 - 82.80 |
0.4949 times |
Fri 21 November 2025 |
75.05 (-27.07%) |
103.95 |
72.00 - 105.25 |
4.8741 times |
Fri 14 November 2025 |
102.90 (-5.51%) |
109.85 |
101.00 - 109.85 |
0.1357 times |
Fri 07 November 2025 |
108.90 (0.28%) |
106.30 |
97.00 - 110.00 |
0.3234 times |
Fri 31 October 2025 |
108.60 (-7.73%) |
115.00 |
105.10 - 115.00 |
0.2803 times |
Thu 23 October 2025 |
117.70 (0.51%) |
118.70 |
114.55 - 118.70 |
0.158 times |
Fri 17 October 2025 |
117.10 (-0.51%) |
117.15 |
113.75 - 120.00 |
0.325 times |
Fri 10 October 2025 |
117.70 (-0.38%) |
119.45 |
109.05 - 122.90 |
0.6768 times |
Fri 03 October 2025 |
118.15 (-2.4%) |
123.20 |
115.05 - 123.20 |
2.3021 times |
Fri 26 September 2025 |
121.05 (-2.97%) |
123.00 |
120.00 - 124.95 |
0.6146 times |

Monthly price and charts GarnetIntl Strong monthly Stock price targets for GarnetIntl 512493 are 68.73 and 77.43 | Monthly Target 1 | 66.85 | | Monthly Target 2 | 70.6 | | Monthly Target 3 | 75.55 | | Monthly Target 4 | 79.3 | | Monthly Target 5 | 84.25 |
Monthly price and volumes Garnet Intl
| Date |
Closing |
Open |
Range |
Volume |
Fri 05 December 2025 |
74.35 (-5.65%) |
80.50 |
71.80 - 80.50 |
0.1123 times |
Fri 28 November 2025 |
78.80 (-27.44%) |
106.30 |
65.00 - 110.00 |
1.5238 times |
Fri 31 October 2025 |
108.60 (-8.89%) |
120.00 |
105.10 - 122.90 |
0.5702 times |
Tue 30 September 2025 |
119.20 (-5.81%) |
127.95 |
118.20 - 128.00 |
1.3497 times |
Fri 29 August 2025 |
126.55 (2.47%) |
123.95 |
119.55 - 135.00 |
1.2359 times |
Thu 31 July 2025 |
123.50 (-3.97%) |
127.90 |
115.55 - 131.95 |
0.5234 times |
Mon 30 June 2025 |
128.60 (6.46%) |
123.40 |
104.55 - 132.00 |
1.3485 times |
Fri 30 May 2025 |
120.80 (1.47%) |
119.05 |
112.55 - 128.00 |
1.0469 times |
Wed 30 April 2025 |
119.05 (4.38%) |
112.15 |
108.05 - 134.00 |
1.0664 times |
Fri 28 March 2025 |
114.05 (-15.42%) |
140.25 |
109.00 - 140.25 |
1.2229 times |
Fri 28 February 2025 |
134.85 (-2%) |
136.45 |
103.80 - 146.00 |
0.8017 times |

DMA SMA EMA moving averages of Garnet Intl 512493
DMA (daily moving average) of Garnet Intl 512493
| DMA period | DMA value | | 5 day DMA | 75.35 | | 12 day DMA | 75.66 | | 20 day DMA | 86.51 | | 35 day DMA | 97.32 | | 50 day DMA | 103.78 | | 100 day DMA | 114.36 | | 150 day DMA | 116.61 | | 200 day DMA | 118.19 | EMA (exponential moving average) of Garnet Intl 512493
| EMA period | EMA current | EMA prev | EMA prev2 | | 5 day EMA | 75.06 | 75.41 | 76.62 | | 12 day EMA | 79.19 | 80.07 | 81.35 | | 20 day EMA | 84.82 | 85.92 | 87.28 | | 35 day EMA | 93.54 | 94.67 | 95.95 | | 50 day EMA | 102.59 | 103.74 | 104.99 |
SMA (simple moving average) of Garnet Intl 512493
| SMA period | SMA current | SMA prev | SMA prev2 | | 5 day SMA | 75.35 | 76.24 | 77.9 | | 12 day SMA | 75.66 | 76.67 | 79.05 | | 20 day SMA | 86.51 | 87.87 | 89.33 | | 35 day SMA | 97.32 | 98.53 | 99.81 | | 50 day SMA | 103.78 | 104.78 | 105.77 | | 100 day SMA | 114.36 | 114.85 | 115.39 | | 150 day SMA | 116.61 | 116.91 | 117.27 | | 200 day SMA | 118.19 | 118.49 | 118.82 |
|
|
