ApolloFin 512437 full analysis,charts,indicators,moving averages,SMA,DMA,EMA,ADX,MACD,RSIApollo Fin 512437 WideScreen charts, DMA,SMA,EMA technical analysis, forecast prediction, by indicators ADX,MACD,RSI,CCI BSE stock exchange
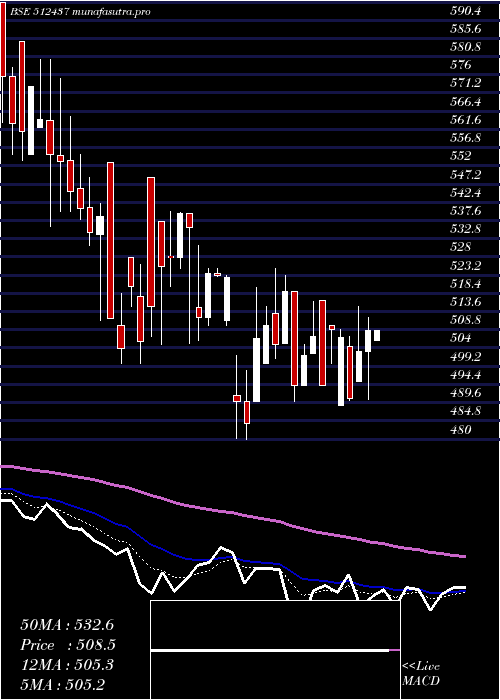
Daily price and charts and targets ApolloFin Strong Daily Stock price targets for ApolloFin 512437 are 468.03 and 490.43 | Daily Target 1 | 463.25 | | Daily Target 2 | 472.8 | | Daily Target 3 | 485.65 | | Daily Target 4 | 495.2 | | Daily Target 5 | 508.05 |
Daily price and volume Apollo Fin
| Date |
Closing |
Open |
Range |
Volume |
Thu 23 October 2025 |
482.35 (-1.35%) |
490.00 |
476.10 - 498.50 |
0.1002 times |
Tue 21 October 2025 |
488.95 (3.19%) |
490.00 |
475.05 - 494.95 |
0.553 times |
Mon 20 October 2025 |
473.85 (6.6%) |
450.25 |
445.10 - 490.00 |
1.2658 times |
Fri 17 October 2025 |
444.50 (4.18%) |
425.05 |
425.05 - 450.00 |
0.3516 times |
Thu 16 October 2025 |
426.65 (6.29%) |
417.50 |
403.50 - 433.85 |
1.3255 times |
Wed 15 October 2025 |
401.40 (-3.94%) |
422.00 |
390.50 - 425.00 |
3.1742 times |
Tue 14 October 2025 |
417.85 (-5.24%) |
441.90 |
415.00 - 442.00 |
1.2563 times |
Mon 13 October 2025 |
440.95 (-2.87%) |
463.00 |
428.00 - 463.00 |
0.3591 times |
Fri 10 October 2025 |
454.00 (0.38%) |
453.00 |
450.00 - 466.30 |
0.6489 times |
Thu 09 October 2025 |
452.30 (1.29%) |
446.60 |
427.40 - 455.90 |
0.9654 times |
Wed 08 October 2025 |
446.55 (-4.84%) |
469.25 |
426.05 - 469.25 |
1.2531 times |
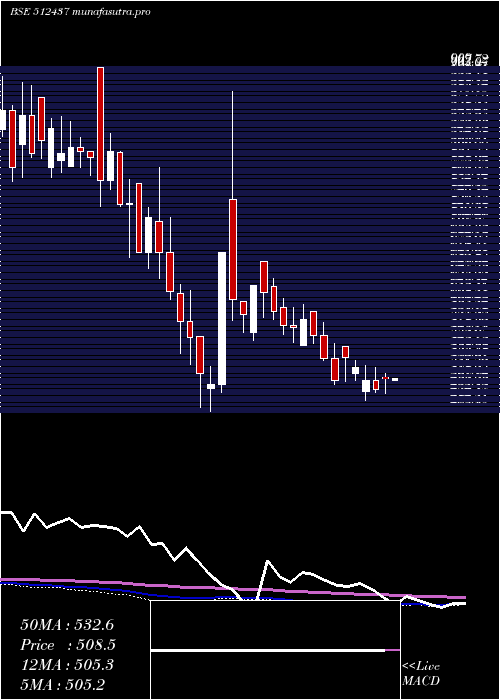
Weekly price and charts ApolloFin Strong weekly Stock price targets for ApolloFin 512437 are 463.73 and 517.13 | Weekly Target 1 | 421.92 | | Weekly Target 2 | 452.13 | | Weekly Target 3 | 475.31666666667 | | Weekly Target 4 | 505.53 | | Weekly Target 5 | 528.72 |
Weekly price and volumes for Apollo Fin
| Date |
Closing |
Open |
Range |
Volume |
Thu 23 October 2025 |
482.35 (8.52%) |
450.25 |
445.10 - 498.50 |
0.5308 times |
Fri 17 October 2025 |
444.50 (-2.09%) |
463.00 |
390.50 - 463.00 |
1.7887 times |
Fri 10 October 2025 |
454.00 (0.84%) |
487.75 |
426.05 - 487.75 |
1.031 times |
Fri 03 October 2025 |
450.20 (-8.12%) |
499.95 |
445.05 - 499.95 |
1.3611 times |
Fri 26 September 2025 |
490.00 (-1.1%) |
493.90 |
481.05 - 513.95 |
0.7625 times |
Fri 19 September 2025 |
495.45 (-0.91%) |
509.95 |
467.55 - 518.95 |
0.8718 times |
Fri 12 September 2025 |
500.00 (-1.55%) |
510.00 |
488.00 - 587.10 |
2.5662 times |
Fri 05 September 2025 |
507.85 (0.6%) |
521.95 |
485.20 - 527.50 |
0.7471 times |
Fri 29 August 2025 |
504.80 (-3.06%) |
518.15 |
495.00 - 523.00 |
0.1438 times |
Fri 22 August 2025 |
520.75 (-0.06%) |
490.05 |
490.05 - 544.00 |
0.1969 times |
Thu 14 August 2025 |
521.05 (1.66%) |
512.55 |
505.00 - 553.00 |
0.9688 times |
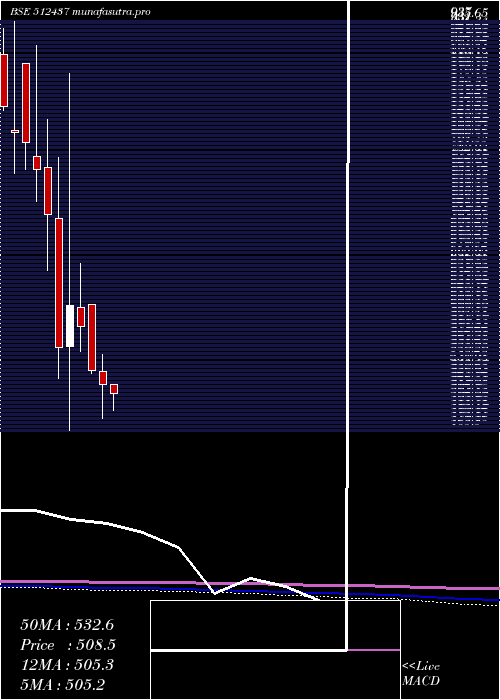
Monthly price and charts ApolloFin Strong monthly Stock price targets for ApolloFin 512437 are 381.88 and 490.98 | Monthly Target 1 | 348.38 | | Monthly Target 2 | 415.37 | | Monthly Target 3 | 457.48333333333 | | Monthly Target 4 | 524.47 | | Monthly Target 5 | 566.58 |
Monthly price and volumes Apollo Fin
| Date |
Closing |
Open |
Range |
Volume |
Thu 23 October 2025 |
482.35 (3.19%) |
499.60 |
390.50 - 499.60 |
0.982 times |
Tue 30 September 2025 |
467.45 (-7.4%) |
521.95 |
460.00 - 587.10 |
1.4051 times |
Fri 29 August 2025 |
504.80 (-3.84%) |
525.00 |
490.05 - 553.00 |
0.572 times |
Thu 31 July 2025 |
524.95 (1.16%) |
518.95 |
488.85 - 564.00 |
0.4885 times |
Mon 30 June 2025 |
518.95 (-2.88%) |
534.00 |
480.00 - 552.85 |
1.1973 times |
Fri 30 May 2025 |
534.35 (-8.66%) |
611.20 |
531.00 - 611.20 |
1.037 times |
Wed 30 April 2025 |
585.00 (-4.14%) |
607.00 |
556.95 - 658.75 |
0.871 times |
Fri 28 March 2025 |
610.25 (8.72%) |
562.10 |
465.50 - 877.65 |
1.9144 times |
Fri 28 February 2025 |
561.30 (-21.5%) |
710.00 |
526.00 - 780.00 |
0.9822 times |
Fri 31 January 2025 |
715.00 (-6.69%) |
769.00 |
650.00 - 823.95 |
0.5504 times |
Tue 31 December 2024 |
766.25 (-3.92%) |
781.60 |
729.95 - 909.00 |
0.6483 times |
DMA SMA EMA moving averages of Apollo Fin 512437
DMA (daily moving average) of Apollo Fin 512437
| DMA period | DMA value | | 5 day DMA | 463.26 | | 12 day DMA | 449.88 | | 20 day DMA | 459.86 | | 35 day DMA | 479.23 | | 50 day DMA | 489.88 | | 100 day DMA | 503.4 | | 150 day DMA | 529.44 | | 200 day DMA | 566.97 | EMA (exponential moving average) of Apollo Fin 512437
| EMA period | EMA current | EMA prev | EMA prev2 | | 5 day EMA | 467.86 | 460.61 | 446.44 | | 12 day EMA | 459.14 | 454.92 | 448.73 | | 20 day EMA | 463.29 | 461.29 | 458.38 | | 35 day EMA | 474.26 | 473.78 | 472.89 | | 50 day EMA | 489.52 | 489.81 | 489.84 |
SMA (simple moving average) of Apollo Fin 512437
| SMA period | SMA current | SMA prev | SMA prev2 | | 5 day SMA | 463.26 | 447.07 | 432.85 | | 12 day SMA | 449.88 | 446.67 | 443.44 | | 20 day SMA | 459.86 | 460.74 | 461.54 | | 35 day SMA | 479.23 | 480.07 | 480.58 | | 50 day SMA | 489.88 | 490.48 | 490.88 | | 100 day SMA | 503.4 | 503.98 | 504.55 | | 150 day SMA | 529.44 | 529.65 | 529.71 | | 200 day SMA | 566.97 | 568.31 | 569.83 |
|
|
