JaiCorp 512237 full analysis,charts,indicators,moving averages,SMA,DMA,EMA,ADX,MACD,RSIJai Corp 512237 WideScreen charts, DMA,SMA,EMA technical analysis, forecast prediction, by indicators ADX,MACD,RSI,CCI BSE stock exchange
Daily price and charts and targets JaiCorp Strong Daily Stock price targets for JaiCorp 512237 are 160.63 and 164.28 | Daily Target 1 | 157.98 | | Daily Target 2 | 159.62 | | Daily Target 3 | 161.63333333333 | | Daily Target 4 | 163.27 | | Daily Target 5 | 165.28 |
Daily price and volume Jai Corp
| Date |
Closing |
Open |
Range |
Volume |
Tue 21 October 2025 |
161.25 (-0.31%) |
161.10 |
160.00 - 163.65 |
0.0482 times |
Mon 20 October 2025 |
161.75 (3.22%) |
157.10 |
154.80 - 165.00 |
0.2331 times |
Fri 17 October 2025 |
156.70 (-2.76%) |
160.00 |
155.80 - 160.80 |
0.1687 times |
Thu 16 October 2025 |
161.15 (3.6%) |
157.55 |
156.30 - 167.25 |
0.5954 times |
Wed 15 October 2025 |
155.55 (-0.92%) |
157.35 |
153.70 - 157.35 |
0.1732 times |
Tue 14 October 2025 |
157.00 (-1.1%) |
156.90 |
155.45 - 162.95 |
0.1486 times |
Mon 13 October 2025 |
158.75 (-2.25%) |
159.20 |
156.65 - 160.25 |
0.142 times |
Fri 10 October 2025 |
162.40 (2.85%) |
157.85 |
157.65 - 166.65 |
1.0737 times |
Thu 09 October 2025 |
157.90 (-3.19%) |
162.25 |
155.50 - 162.45 |
0.6098 times |
Wed 08 October 2025 |
163.10 (13.34%) |
145.35 |
145.10 - 169.70 |
6.8074 times |
Tue 07 October 2025 |
143.90 (-1.2%) |
146.90 |
143.15 - 146.90 |
0.1188 times |
Weekly price and charts JaiCorp Strong weekly Stock price targets for JaiCorp 512237 are 158.03 and 168.23 | Weekly Target 1 | 150.15 | | Weekly Target 2 | 155.7 | | Weekly Target 3 | 160.35 | | Weekly Target 4 | 165.9 | | Weekly Target 5 | 170.55 |
Weekly price and volumes for Jai Corp
| Date |
Closing |
Open |
Range |
Volume |
Tue 21 October 2025 |
161.25 (2.9%) |
157.10 |
154.80 - 165.00 |
0.0661 times |
Fri 17 October 2025 |
156.70 (-3.51%) |
159.20 |
153.70 - 167.25 |
0.2884 times |
Fri 10 October 2025 |
162.40 (10.1%) |
145.55 |
143.15 - 169.70 |
2.0452 times |
Fri 03 October 2025 |
147.50 (2.68%) |
146.00 |
137.90 - 148.40 |
0.1368 times |
Fri 26 September 2025 |
143.65 (-9.34%) |
157.80 |
142.60 - 160.75 |
0.2428 times |
Fri 19 September 2025 |
158.45 (-0.35%) |
159.55 |
157.35 - 167.35 |
0.3445 times |
Fri 12 September 2025 |
159.00 (-0.78%) |
163.00 |
157.45 - 178.00 |
1.0885 times |
Fri 05 September 2025 |
160.25 (33.43%) |
120.80 |
120.60 - 174.90 |
4.7029 times |
Fri 29 August 2025 |
120.10 (-7.29%) |
131.70 |
118.15 - 131.70 |
0.251 times |
Fri 22 August 2025 |
129.55 (21.7%) |
108.80 |
107.60 - 138.90 |
0.8337 times |
Thu 14 August 2025 |
106.45 (-1.02%) |
113.00 |
105.65 - 113.00 |
0.0519 times |
Monthly price and charts JaiCorp Strong monthly Stock price targets for JaiCorp 512237 are 150.58 and 180.38 | Monthly Target 1 | 127.15 | | Monthly Target 2 | 144.2 | | Monthly Target 3 | 156.95 | | Monthly Target 4 | 174 | | Monthly Target 5 | 186.75 |
Monthly price and volumes Jai Corp
| Date |
Closing |
Open |
Range |
Volume |
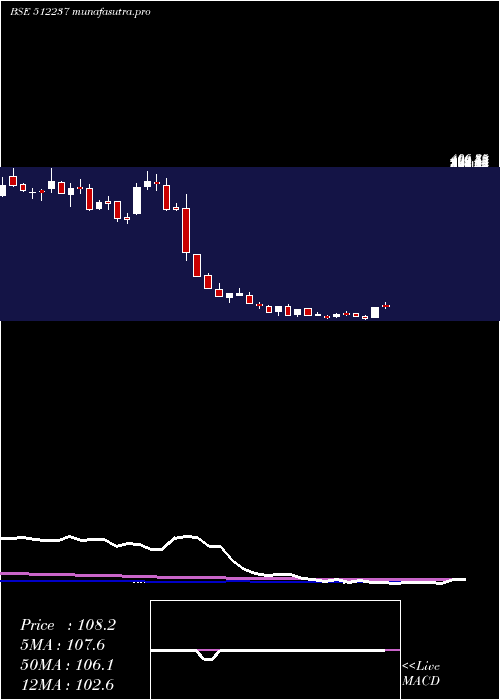
Tue 21 October 2025 |
161.25 (15.59%) |
140.00 |
139.90 - 169.70 |
1.4086 times |
Tue 30 September 2025 |
139.50 (16.15%) |
120.80 |
120.60 - 178.00 |
3.6819 times |
Fri 29 August 2025 |
120.10 (8.1%) |
107.95 |
104.65 - 138.90 |
0.7566 times |
Thu 31 July 2025 |
111.10 (-2.33%) |
115.40 |
102.70 - 115.70 |
0.4514 times |
Mon 30 June 2025 |
113.75 (0.58%) |
111.80 |
106.10 - 127.30 |
0.3783 times |
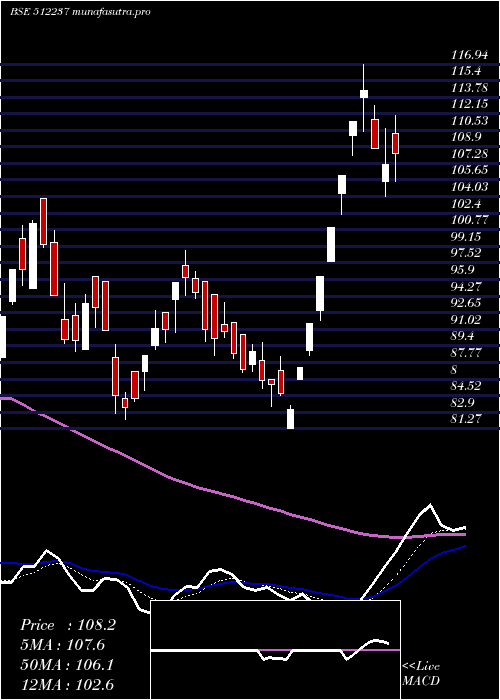
Fri 30 May 2025 |
113.09 (27.53%) |
90.50 |
81.27 - 116.94 |
0.6744 times |
Wed 30 April 2025 |
88.68 (-1.39%) |
89.02 |
82.17 - 98.78 |
0.3038 times |
Fri 28 March 2025 |
89.93 (-5.59%) |
97.19 |
87.20 - 112.20 |
0.4406 times |
Fri 28 February 2025 |
95.25 (-30.09%) |
132.60 |
95.15 - 146.80 |
0.3584 times |
Fri 31 January 2025 |
136.25 (-58.31%) |
328.55 |
118.35 - 343.80 |
1.546 times |
Tue 31 December 2024 |
326.85 (-10.66%) |
366.95 |
315.50 - 401.00 |
0.3738 times |

DMA SMA EMA moving averages of Jai Corp 512237
DMA (daily moving average) of Jai Corp 512237
| DMA period | DMA value | | 5 day DMA | 159.28 | | 12 day DMA | 157.09 | | 20 day DMA | 152.98 | | 35 day DMA | 156.22 | | 50 day DMA | 144.92 | | 100 day DMA | 128.28 | | 150 day DMA | 117.29 | | 200 day DMA | 128.57 | EMA (exponential moving average) of Jai Corp 512237
| EMA period | EMA current | EMA prev | EMA prev2 | | 5 day EMA | 159.76 | 159.01 | 157.64 | | 12 day EMA | 157.32 | 156.61 | 155.68 | | 20 day EMA | 155.09 | 154.44 | 153.67 | | 35 day EMA | 148.47 | 147.72 | 146.89 | | 50 day EMA | 143.47 | 142.74 | 141.96 |
SMA (simple moving average) of Jai Corp 512237
| SMA period | SMA current | SMA prev | SMA prev2 | | 5 day SMA | 159.28 | 158.43 | 157.83 | | 12 day SMA | 157.09 | 155.95 | 154.54 | | 20 day SMA | 152.98 | 152.73 | 152.56 | | 35 day SMA | 156.22 | 155.16 | 153.97 | | 50 day SMA | 144.92 | 143.89 | 142.82 | | 100 day SMA | 128.28 | 127.77 | 127.22 | | 150 day SMA | 117.29 | 116.89 | 116.46 | | 200 day SMA | 128.57 | 129.38 | 130.15 |
|
|
