VamaInds 512175 full analysis,charts,indicators,moving averages,SMA,DMA,EMA,ADX,MACD,RSIVama Inds 512175 WideScreen charts, DMA,SMA,EMA technical analysis, forecast prediction, by indicators ADX,MACD,RSI,CCI BSE stock exchange
Daily price and charts and targets VamaInds Strong Daily Stock price targets for VamaInds 512175 are 5.85 and 6.21 | Daily Target 1 | 5.57 | | Daily Target 2 | 5.76 | | Daily Target 3 | 5.9266666666667 | | Daily Target 4 | 6.12 | | Daily Target 5 | 6.29 |
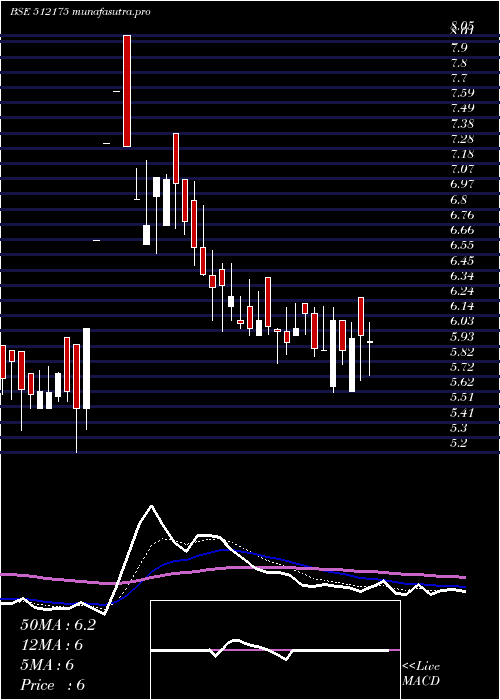
Daily price and volume Vama Inds
| Date |
Closing |
Open |
Range |
Volume |
Tue 21 October 2025 |
5.96 (-0.67%) |
5.95 |
5.73 - 6.09 |
0.1083 times |
Mon 20 October 2025 |
6.00 (0.33%) |
6.26 |
5.69 - 6.26 |
0.4234 times |
Fri 17 October 2025 |
5.98 (1.36%) |
5.62 |
5.62 - 6.09 |
0.2253 times |
Thu 16 October 2025 |
5.90 (-3.28%) |
6.10 |
5.80 - 6.10 |
1.4065 times |
Wed 15 October 2025 |
6.10 (3.39%) |
5.65 |
5.61 - 6.19 |
1.79 times |
Tue 14 October 2025 |
5.90 (-0.17%) |
5.90 |
5.90 - 6.20 |
1.3467 times |
Mon 13 October 2025 |
5.91 (-3.9%) |
6.15 |
5.86 - 6.19 |
1.6914 times |
Fri 10 October 2025 |
6.15 (1.65%) |
6.22 |
6.01 - 6.22 |
0.6114 times |
Thu 09 October 2025 |
6.05 (1.68%) |
6.00 |
6.00 - 6.22 |
1.634 times |
Wed 08 October 2025 |
5.95 (-1.33%) |
6.03 |
5.87 - 6.19 |
0.763 times |
Tue 07 October 2025 |
6.03 (-0.5%) |
6.04 |
5.81 - 6.05 |
1.4773 times |
Weekly price and charts VamaInds Strong weekly Stock price targets for VamaInds 512175 are 5.54 and 6.11 | Weekly Target 1 | 5.4 | | Weekly Target 2 | 5.68 | | Weekly Target 3 | 5.97 | | Weekly Target 4 | 6.25 | | Weekly Target 5 | 6.54 |
Weekly price and volumes for Vama Inds
| Date |
Closing |
Open |
Range |
Volume |
Tue 21 October 2025 |
5.96 (-0.33%) |
6.26 |
5.69 - 6.26 |
0.057 times |
Fri 17 October 2025 |
5.98 (-2.76%) |
6.15 |
5.61 - 6.20 |
0.693 times |
Fri 10 October 2025 |
6.15 (0.82%) |
6.40 |
5.81 - 6.40 |
0.5078 times |
Fri 03 October 2025 |
6.10 (-3.79%) |
6.20 |
6.00 - 6.49 |
0.4685 times |
Fri 26 September 2025 |
6.34 (-9.94%) |
7.07 |
6.03 - 7.07 |
0.7002 times |
Fri 19 September 2025 |
7.04 (-3.43%) |
6.93 |
6.56 - 7.38 |
1.5055 times |
Fri 12 September 2025 |
7.29 (32.55%) |
5.50 |
5.36 - 8.05 |
3.9898 times |
Fri 05 September 2025 |
5.50 (-1.79%) |
5.50 |
5.20 - 5.99 |
0.4754 times |
Fri 29 August 2025 |
5.60 (-3.78%) |
5.93 |
5.35 - 5.93 |
0.6005 times |
Fri 22 August 2025 |
5.82 (-2.35%) |
5.65 |
5.46 - 5.94 |
1.0024 times |
Thu 14 August 2025 |
5.96 (6.43%) |
5.60 |
5.50 - 6.13 |
0.9704 times |

Monthly price and charts VamaInds Strong monthly Stock price targets for VamaInds 512175 are 5.39 and 6.18 | Monthly Target 1 | 5.2 | | Monthly Target 2 | 5.58 | | Monthly Target 3 | 5.99 | | Monthly Target 4 | 6.37 | | Monthly Target 5 | 6.78 |
Monthly price and volumes Vama Inds
| Date |
Closing |
Open |
Range |
Volume |
Tue 21 October 2025 |
5.96 (-1.97%) |
6.20 |
5.61 - 6.40 |
0.1842 times |
Tue 30 September 2025 |
6.08 (8.57%) |
5.50 |
5.20 - 8.05 |
0.8293 times |
Fri 29 August 2025 |
5.60 (-7.13%) |
6.01 |
5.35 - 6.51 |
0.5268 times |
Thu 31 July 2025 |
6.03 (-9.32%) |
6.60 |
5.99 - 7.15 |
0.707 times |
Mon 30 June 2025 |
6.65 (1.06%) |
6.58 |
6.11 - 8.89 |
1.5924 times |
Fri 30 May 2025 |
6.58 (-2.66%) |
6.93 |
6.06 - 6.93 |
0.4753 times |
Wed 30 April 2025 |
6.76 (-0.59%) |
7.06 |
6.61 - 7.69 |
0.4013 times |
Fri 28 March 2025 |
6.80 (-3.27%) |
7.03 |
6.68 - 8.25 |
1.1045 times |
Fri 28 February 2025 |
7.03 (-10.1%) |
8.48 |
7.03 - 11.42 |
3.7043 times |
Fri 31 January 2025 |
7.82 (-12.72%) |
8.95 |
7.27 - 9.26 |
0.4749 times |
Tue 31 December 2024 |
8.96 (10.48%) |
8.10 |
7.85 - 9.61 |
0.6607 times |

DMA SMA EMA moving averages of Vama Inds 512175
DMA (daily moving average) of Vama Inds 512175
| DMA period | DMA value | | 5 day DMA | 5.99 | | 12 day DMA | 6 | | 20 day DMA | 6.11 | | 35 day DMA | 6.32 | | 50 day DMA | 6.14 | | 100 day DMA | 6.42 | | 150 day DMA | 6.57 | | 200 day DMA | 6.98 | EMA (exponential moving average) of Vama Inds 512175
| EMA period | EMA current | EMA prev | EMA prev2 | | 5 day EMA | 5.98 | 5.99 | 5.98 | | 12 day EMA | 6.04 | 6.05 | 6.06 | | 20 day EMA | 6.1 | 6.12 | 6.13 | | 35 day EMA | 6.08 | 6.09 | 6.1 | | 50 day EMA | 6.11 | 6.12 | 6.13 |
SMA (simple moving average) of Vama Inds 512175
| SMA period | SMA current | SMA prev | SMA prev2 | | 5 day SMA | 5.99 | 5.98 | 5.96 | | 12 day SMA | 6 | 6.01 | 6.02 | | 20 day SMA | 6.11 | 6.15 | 6.2 | | 35 day SMA | 6.32 | 6.31 | 6.3 | | 50 day SMA | 6.14 | 6.14 | 6.14 | | 100 day SMA | 6.42 | 6.42 | 6.43 | | 150 day SMA | 6.57 | 6.58 | 6.59 | | 200 day SMA | 6.98 | 6.99 | 7 |
|
|
