RoyalInd 512047 full analysis,charts,indicators,moving averages,SMA,DMA,EMA,ADX,MACD,RSIRoyal Ind 512047 WideScreen charts, DMA,SMA,EMA technical analysis, forecast prediction, by indicators ADX,MACD,RSI,CCI BSE stock exchange
Daily price and charts and targets RoyalInd Strong Daily Stock price targets for RoyalInd 512047 are 6.26 and 7.23 | Daily Target 1 | 6.02 | | Daily Target 2 | 6.5 | | Daily Target 3 | 6.9866666666667 | | Daily Target 4 | 7.47 | | Daily Target 5 | 7.96 |
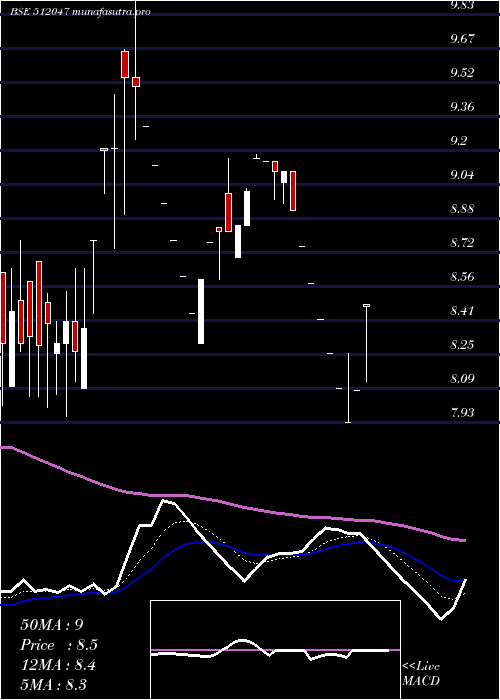
Daily price and volume Royal Ind
| Date |
Closing |
Open |
Range |
Volume |
Fri 05 December 2025 |
6.99 (0.43%) |
7.00 |
6.50 - 7.47 |
0.3162 times |
Thu 04 December 2025 |
6.96 (3.73%) |
6.77 |
6.21 - 7.00 |
0.6764 times |
Wed 03 December 2025 |
6.71 (-9.93%) |
7.68 |
6.71 - 7.68 |
1.8268 times |
Tue 02 December 2025 |
7.45 (-3.12%) |
7.85 |
7.12 - 7.85 |
2.4373 times |
Mon 01 December 2025 |
7.69 (6.66%) |
7.45 |
7.21 - 7.93 |
4.1805 times |
Fri 28 November 2025 |
7.21 (1.84%) |
7.58 |
7.11 - 7.69 |
0.1593 times |
Thu 27 November 2025 |
7.08 (9.94%) |
6.60 |
6.45 - 7.08 |
0.0686 times |
Wed 26 November 2025 |
6.44 (3.7%) |
6.56 |
6.21 - 6.56 |
0.037 times |
Tue 25 November 2025 |
6.21 (-2.51%) |
6.30 |
6.10 - 6.50 |
0.215 times |
Mon 24 November 2025 |
6.37 (-3.48%) |
6.63 |
6.33 - 6.89 |
0.0831 times |
Fri 21 November 2025 |
6.60 (-7.43%) |
7.13 |
6.45 - 7.17 |
0.1048 times |
Weekly price and charts RoyalInd Strong weekly Stock price targets for RoyalInd 512047 are 5.74 and 7.46 | Weekly Target 1 | 5.32 | | Weekly Target 2 | 6.16 | | Weekly Target 3 | 7.0433333333333 | | Weekly Target 4 | 7.88 | | Weekly Target 5 | 8.76 |
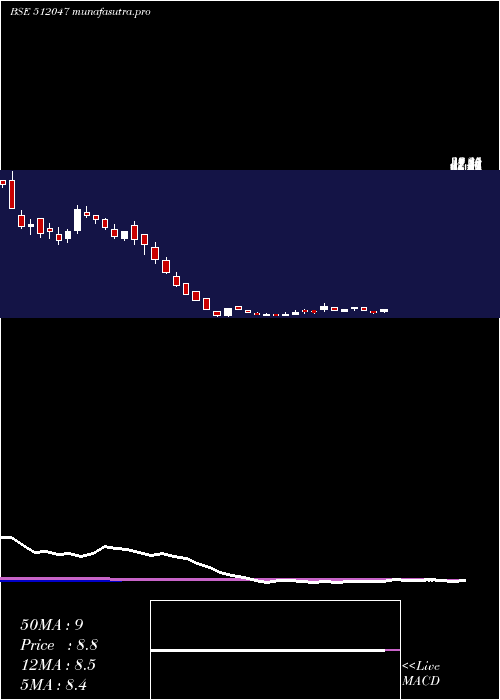
Weekly price and volumes for Royal Ind
| Date |
Closing |
Open |
Range |
Volume |
Fri 05 December 2025 |
6.99 (-3.05%) |
7.45 |
6.21 - 7.93 |
5.6452 times |
Fri 28 November 2025 |
7.21 (9.24%) |
6.63 |
6.10 - 7.69 |
0.3367 times |
Fri 21 November 2025 |
6.60 (-13.04%) |
7.62 |
6.45 - 7.80 |
0.2683 times |
Fri 14 November 2025 |
7.59 (-2.44%) |
7.65 |
7.30 - 7.85 |
0.3647 times |
Fri 07 November 2025 |
7.78 (0.26%) |
7.89 |
7.45 - 8.18 |
0.3063 times |
Fri 31 October 2025 |
7.76 (-3%) |
7.98 |
7.20 - 8.30 |
1.3052 times |
Thu 23 October 2025 |
8.00 (1.91%) |
8.20 |
7.95 - 8.63 |
0.2914 times |
Fri 17 October 2025 |
7.85 (1.68%) |
7.70 |
7.01 - 8.20 |
0.636 times |
Fri 10 October 2025 |
7.72 (2.66%) |
7.85 |
7.10 - 7.92 |
0.3644 times |
Fri 03 October 2025 |
7.52 (4.01%) |
7.34 |
7.02 - 7.68 |
0.4817 times |
Fri 26 September 2025 |
7.23 (-4.87%) |
7.65 |
6.85 - 8.00 |
0.7997 times |
Monthly price and charts RoyalInd Strong monthly Stock price targets for RoyalInd 512047 are 5.74 and 7.46 | Monthly Target 1 | 5.32 | | Monthly Target 2 | 6.16 | | Monthly Target 3 | 7.0433333333333 | | Monthly Target 4 | 7.88 | | Monthly Target 5 | 8.76 |
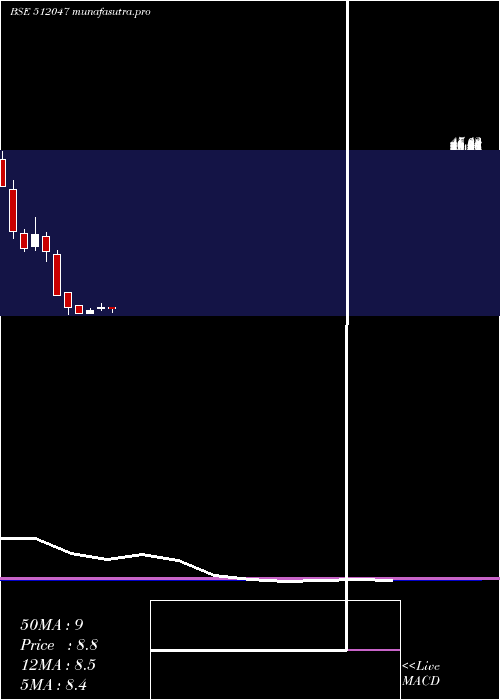
Monthly price and volumes Royal Ind
| Date |
Closing |
Open |
Range |
Volume |
Fri 05 December 2025 |
6.99 (-3.05%) |
7.45 |
6.21 - 7.93 |
2.1654 times |
Fri 28 November 2025 |
7.21 (-7.09%) |
7.89 |
6.10 - 8.18 |
0.4895 times |
Fri 31 October 2025 |
7.76 (5.15%) |
7.53 |
7.01 - 8.63 |
1.142 times |
Tue 30 September 2025 |
7.38 (20.79%) |
6.27 |
5.81 - 8.00 |
1.3854 times |
Fri 29 August 2025 |
6.11 (-23.91%) |
8.24 |
6.11 - 8.50 |
0.5382 times |
Thu 31 July 2025 |
8.03 (-11.76%) |
9.05 |
7.49 - 9.39 |
1.0867 times |
Mon 30 June 2025 |
9.10 (8.72%) |
8.78 |
8.30 - 10.00 |
1.296 times |
Fri 30 May 2025 |
8.37 (8.84%) |
7.70 |
7.62 - 8.78 |
0.311 times |
Wed 30 April 2025 |
7.69 (-14.56%) |
9.45 |
7.54 - 9.45 |
0.1848 times |
Fri 28 March 2025 |
9.00 (-25.68%) |
12.65 |
7.25 - 12.68 |
1.4009 times |
Fri 28 February 2025 |
12.11 (-46.65%) |
21.99 |
12.11 - 22.98 |
0.7281 times |
DMA SMA EMA moving averages of Royal Ind 512047
DMA (daily moving average) of Royal Ind 512047
| DMA period | DMA value | | 5 day DMA | 7.16 | | 12 day DMA | 6.9 | | 20 day DMA | 7.14 | | 35 day DMA | 7.41 | | 50 day DMA | 7.41 | | 100 day DMA | 7.5 | | 150 day DMA | 7.85 | | 200 day DMA | 8.77 | EMA (exponential moving average) of Royal Ind 512047
| EMA period | EMA current | EMA prev | EMA prev2 | | 5 day EMA | 7.02 | 7.04 | 7.08 | | 12 day EMA | 7.06 | 7.07 | 7.09 | | 20 day EMA | 7.13 | 7.15 | 7.17 | | 35 day EMA | 7.22 | 7.23 | 7.25 | | 50 day EMA | 7.36 | 7.38 | 7.4 |
SMA (simple moving average) of Royal Ind 512047
| SMA period | SMA current | SMA prev | SMA prev2 | | 5 day SMA | 7.16 | 7.2 | 7.23 | | 12 day SMA | 6.9 | 6.91 | 6.95 | | 20 day SMA | 7.14 | 7.18 | 7.21 | | 35 day SMA | 7.41 | 7.42 | 7.45 | | 50 day SMA | 7.41 | 7.43 | 7.44 | | 100 day SMA | 7.5 | 7.51 | 7.52 | | 150 day SMA | 7.85 | 7.85 | 7.86 | | 200 day SMA | 8.77 | 8.84 | 8.92 |
|
|
