MuthootCap 511766 full analysis,charts,indicators,moving averages,SMA,DMA,EMA,ADX,MACD,RSIMuthoot Cap 511766 WideScreen charts, DMA,SMA,EMA technical analysis, forecast prediction, by indicators ADX,MACD,RSI,CCI BSE stock exchange
Daily price and charts and targets MuthootCap Strong Daily Stock price targets for MuthootCap 511766 are 276.65 and 281.2 | Daily Target 1 | 273.22 | | Daily Target 2 | 275.53 | | Daily Target 3 | 277.76666666667 | | Daily Target 4 | 280.08 | | Daily Target 5 | 282.32 |
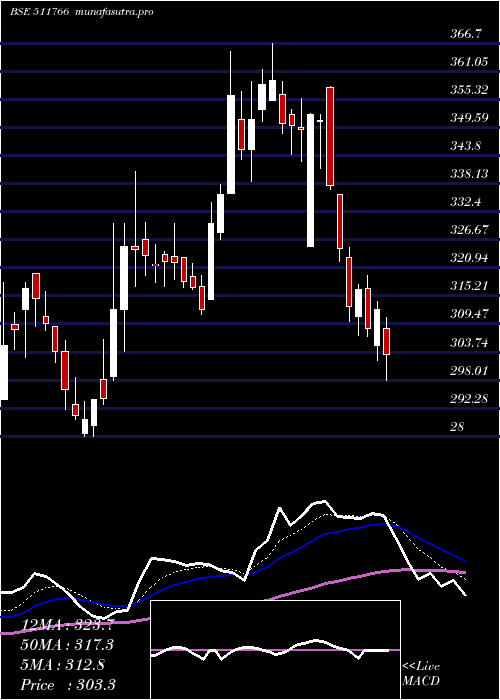
Daily price and volume Muthoot Cap
| Date |
Closing |
Open |
Range |
Volume |
Tue 02 September 2025 |
277.85 (1.11%) |
276.00 |
275.45 - 280.00 |
0.2319 times |
Mon 01 September 2025 |
274.80 (-0.31%) |
275.00 |
273.35 - 279.90 |
1.4095 times |
Fri 29 August 2025 |
275.65 (0.15%) |
280.00 |
273.90 - 280.00 |
1.6199 times |
Thu 28 August 2025 |
275.25 (0.81%) |
272.10 |
271.75 - 280.00 |
0.2098 times |
Tue 26 August 2025 |
273.05 (-2.1%) |
275.30 |
272.10 - 275.30 |
0.6133 times |
Mon 25 August 2025 |
278.90 (-1.03%) |
282.00 |
275.65 - 283.00 |
2.2584 times |
Fri 22 August 2025 |
281.80 (1.18%) |
278.60 |
276.70 - 282.20 |
0.2224 times |
Thu 21 August 2025 |
278.50 (0.92%) |
275.00 |
273.45 - 282.00 |
2.3648 times |
Wed 20 August 2025 |
275.95 (0.97%) |
272.95 |
271.30 - 278.00 |
0.7645 times |
Tue 19 August 2025 |
273.30 (1.11%) |
268.20 |
268.20 - 274.10 |
0.3055 times |
Mon 18 August 2025 |
270.30 (-0.15%) |
286.90 |
270.00 - 286.90 |
0.8907 times |
Weekly price and charts MuthootCap Strong weekly Stock price targets for MuthootCap 511766 are 275.6 and 282.25 | Weekly Target 1 | 270.42 | | Weekly Target 2 | 274.13 | | Weekly Target 3 | 277.06666666667 | | Weekly Target 4 | 280.78 | | Weekly Target 5 | 283.72 |
Weekly price and volumes for Muthoot Cap
| Date |
Closing |
Open |
Range |
Volume |
Tue 02 September 2025 |
277.85 (0.8%) |
275.00 |
273.35 - 280.00 |
0.1897 times |
Fri 29 August 2025 |
275.65 (-2.18%) |
282.00 |
271.75 - 283.00 |
0.5433 times |
Fri 22 August 2025 |
281.80 (4.1%) |
286.90 |
268.20 - 286.90 |
0.5255 times |
Thu 14 August 2025 |
270.70 (-0.79%) |
270.85 |
263.95 - 290.45 |
1.0485 times |
Fri 08 August 2025 |
272.85 (-10.04%) |
300.25 |
241.50 - 312.00 |
2.9868 times |
Fri 01 August 2025 |
303.30 (-6.65%) |
323.00 |
298.00 - 325.00 |
0.5731 times |
Fri 25 July 2025 |
324.90 (-7.18%) |
349.55 |
322.20 - 357.85 |
0.8483 times |
Fri 18 July 2025 |
350.05 (1.43%) |
345.10 |
338.50 - 366.70 |
1.5035 times |
Fri 11 July 2025 |
345.10 (8.88%) |
317.10 |
311.50 - 365.00 |
1.325 times |
Fri 04 July 2025 |
316.95 (-2.04%) |
321.70 |
316.55 - 330.05 |
0.4564 times |
Fri 27 June 2025 |
323.55 (10.05%) |
298.20 |
293.00 - 340.60 |
2.2782 times |

Monthly price and charts MuthootCap Strong monthly Stock price targets for MuthootCap 511766 are 275.6 and 282.25 | Monthly Target 1 | 270.42 | | Monthly Target 2 | 274.13 | | Monthly Target 3 | 277.06666666667 | | Monthly Target 4 | 280.78 | | Monthly Target 5 | 283.72 |
Monthly price and volumes Muthoot Cap
| Date |
Closing |
Open |
Range |
Volume |
Tue 02 September 2025 |
277.85 (0.8%) |
275.00 |
273.35 - 280.00 |
0.0463 times |
Fri 29 August 2025 |
275.65 (-11.78%) |
308.60 |
241.50 - 312.00 |
1.3087 times |
Thu 31 July 2025 |
312.45 (-2.77%) |
323.60 |
301.95 - 366.70 |
1.0593 times |
Mon 30 June 2025 |
321.35 (12.54%) |
283.50 |
282.85 - 340.60 |
1.6964 times |
Fri 30 May 2025 |
285.55 (6.65%) |
270.60 |
260.10 - 298.00 |
1.2609 times |
Wed 30 April 2025 |
267.75 (8.51%) |
247.05 |
244.00 - 289.10 |
1.3241 times |
Fri 28 March 2025 |
246.75 (-9.67%) |
272.30 |
244.00 - 282.00 |
1.0198 times |
Fri 28 February 2025 |
273.15 (-6.18%) |
286.15 |
254.95 - 306.10 |
0.8429 times |
Fri 31 January 2025 |
291.15 (-12.74%) |
333.25 |
281.60 - 346.95 |
0.7836 times |
Tue 31 December 2024 |
333.65 (-9.8%) |
371.60 |
328.05 - 385.00 |
0.658 times |
Fri 29 November 2024 |
369.90 (-1.54%) |
385.00 |
323.10 - 398.10 |
1.3125 times |

DMA SMA EMA moving averages of Muthoot Cap 511766
DMA (daily moving average) of Muthoot Cap 511766
| DMA period | DMA value | | 5 day DMA | 275.32 | | 12 day DMA | 275.5 | | 20 day DMA | 276.7 | | 35 day DMA | 302.06 | | 50 day DMA | 308.65 | | 100 day DMA | 294.67 | | 150 day DMA | 288.42 | | 200 day DMA | 304.11 | EMA (exponential moving average) of Muthoot Cap 511766
| EMA period | EMA current | EMA prev | EMA prev2 | | 5 day EMA | 276.28 | 275.49 | 275.84 | | 12 day EMA | 277.63 | 277.59 | 278.1 | | 20 day EMA | 282.67 | 283.18 | 284.06 | | 35 day EMA | 291.69 | 292.51 | 293.55 | | 50 day EMA | 304.24 | 305.32 | 306.56 |
SMA (simple moving average) of Muthoot Cap 511766
| SMA period | SMA current | SMA prev | SMA prev2 | | 5 day SMA | 275.32 | 275.53 | 276.93 | | 12 day SMA | 275.5 | 274.71 | 274.39 | | 20 day SMA | 276.7 | 277.97 | 279.86 | | 35 day SMA | 302.06 | 303.98 | 306.3 | | 50 day SMA | 308.65 | 308.97 | 309.28 | | 100 day SMA | 294.67 | 294.39 | 294.11 | | 150 day SMA | 288.42 | 288.6 | 288.84 | | 200 day SMA | 304.11 | 304.62 | 305.13 |
|
|
