RR 511626 full analysis,charts,indicators,moving averages,SMA,DMA,EMA,ADX,MACD,RSIR R 511626 WideScreen charts, DMA,SMA,EMA technical analysis, forecast prediction, by indicators ADX,MACD,RSI,CCI BSE stock exchange
Daily price and charts and targets RR Strong Daily Stock price targets for RR 511626 are 162.05 and 162.05 | Daily Target 1 | 162.05 | | Daily Target 2 | 162.05 | | Daily Target 3 | 162.05 | | Daily Target 4 | 162.05 | | Daily Target 5 | 162.05 |
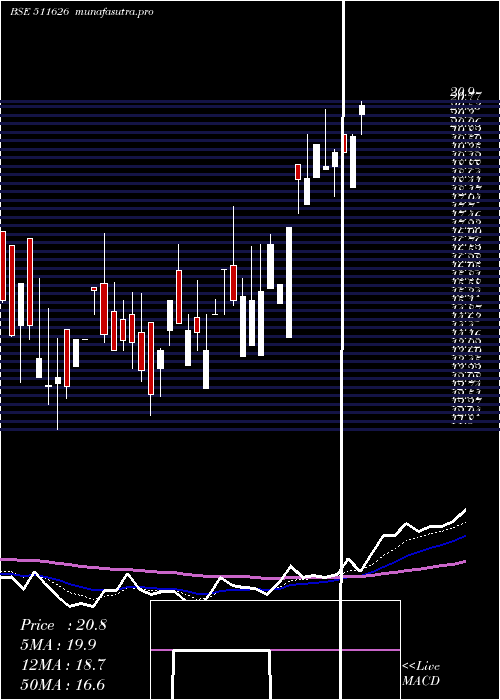
Daily price and volume R R
| Date |
Closing |
Open |
Range |
Volume |
Thu 23 October 2025 |
162.05 (4.99%) |
162.05 |
162.05 - 162.05 |
0.3636 times |
Tue 21 October 2025 |
154.35 (5%) |
154.35 |
154.35 - 154.35 |
0.1828 times |
Mon 20 October 2025 |
147.00 (5%) |
147.00 |
142.80 - 147.00 |
1.6452 times |
Fri 17 October 2025 |
140.00 (4.99%) |
140.00 |
140.00 - 140.00 |
0.8372 times |
Thu 16 October 2025 |
133.35 (5%) |
120.65 |
120.65 - 133.35 |
2.3945 times |
Wed 15 October 2025 |
127.00 (-4.98%) |
127.00 |
127.00 - 127.00 |
0.0968 times |
Tue 14 October 2025 |
133.65 (-4.98%) |
133.65 |
133.65 - 133.65 |
0.0728 times |
Mon 13 October 2025 |
140.65 (-5%) |
140.65 |
140.65 - 140.65 |
0.1745 times |
Fri 10 October 2025 |
148.05 (-4.97%) |
160.00 |
148.05 - 160.00 |
1.1963 times |
Thu 09 October 2025 |
155.80 (4.99%) |
155.80 |
149.85 - 155.80 |
3.0363 times |
Wed 08 October 2025 |
148.40 (4.99%) |
148.40 |
148.40 - 148.40 |
0.1994 times |
Weekly price and charts RR Strong weekly Stock price targets for RR 511626 are 152.43 and 171.68 | Weekly Target 1 | 136.38 | | Weekly Target 2 | 149.22 | | Weekly Target 3 | 155.63333333333 | | Weekly Target 4 | 168.47 | | Weekly Target 5 | 174.88 |
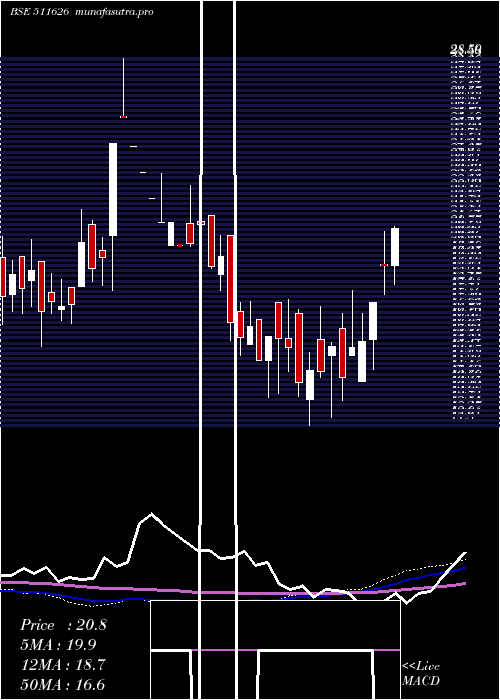
Weekly price and volumes for R R
| Date |
Closing |
Open |
Range |
Volume |
Thu 23 October 2025 |
162.05 (15.75%) |
147.00 |
142.80 - 162.05 |
0.6308 times |
Fri 17 October 2025 |
140.00 (-5.44%) |
140.65 |
120.65 - 140.65 |
1.0293 times |
Fri 10 October 2025 |
148.05 (15.44%) |
134.65 |
134.65 - 160.00 |
1.3864 times |
Fri 03 October 2025 |
128.25 (21.48%) |
110.84 |
110.60 - 128.25 |
2.0984 times |
Fri 26 September 2025 |
105.57 (27.59%) |
86.87 |
84.39 - 105.57 |
0.692 times |
Fri 19 September 2025 |
82.74 (3.93%) |
75.70 |
68.26 - 82.74 |
3.3406 times |
Fri 12 September 2025 |
79.61 (-9.59%) |
86.29 |
79.61 - 86.29 |
0.0495 times |
Fri 05 September 2025 |
88.05 (-2.08%) |
91.71 |
88.05 - 95.40 |
0.6233 times |
Fri 29 August 2025 |
89.92 (8.22%) |
84.75 |
84.75 - 89.92 |
0.0608 times |
Fri 22 August 2025 |
83.09 (10.36%) |
76.79 |
76.79 - 83.09 |
0.0888 times |
Thu 14 August 2025 |
75.29 (8.21%) |
70.97 |
70.97 - 75.29 |
0.2422 times |
Monthly price and charts RR Strong monthly Stock price targets for RR 511626 are 136.33 and 187.78 | Monthly Target 1 | 93.45 | | Monthly Target 2 | 127.75 | | Monthly Target 3 | 144.9 | | Monthly Target 4 | 179.2 | | Monthly Target 5 | 196.35 |
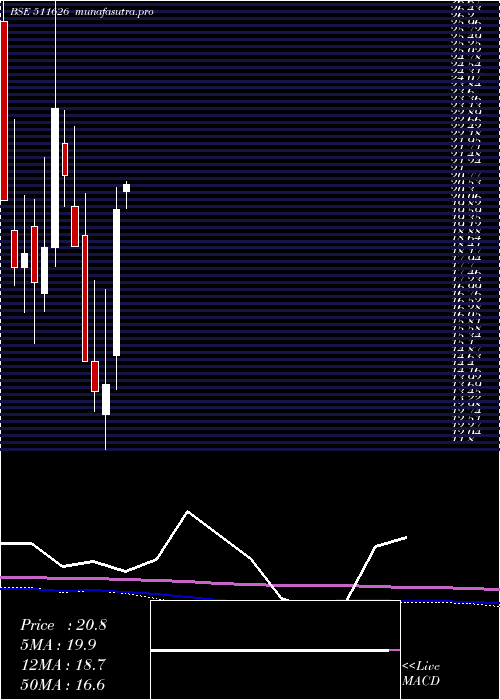
Monthly price and volumes R R
| Date |
Closing |
Open |
Range |
Volume |
Thu 23 October 2025 |
162.05 (39.24%) |
122.15 |
110.60 - 162.05 |
2.3378 times |
Tue 30 September 2025 |
116.38 (29.43%) |
91.71 |
68.26 - 116.38 |
2.3483 times |
Fri 29 August 2025 |
89.92 (45.36%) |
63.09 |
63.09 - 89.92 |
0.5621 times |
Thu 31 July 2025 |
61.86 (71.6%) |
37.85 |
36.45 - 61.86 |
0.8912 times |
Mon 30 June 2025 |
36.05 (55.45%) |
22.04 |
22.04 - 36.05 |
0.8087 times |
Fri 30 May 2025 |
23.19 (16.24%) |
20.55 |
15.45 - 23.60 |
0.2288 times |
Wed 30 April 2025 |
19.95 (42.4%) |
15.00 |
13.84 - 20.69 |
0.4462 times |
Fri 28 March 2025 |
14.01 (1.6%) |
13.00 |
11.80 - 17.24 |
1.9414 times |
Fri 28 February 2025 |
13.79 (-6.76%) |
14.79 |
13.08 - 17.55 |
0.276 times |
Thu 30 January 2025 |
14.79 (-20.95%) |
19.08 |
14.79 - 20.50 |
0.1595 times |
Tue 31 December 2024 |
18.71 (-11.28%) |
20.05 |
18.70 - 22.78 |
0.4309 times |
DMA SMA EMA moving averages of R R 511626
DMA (daily moving average) of R R 511626
| DMA period | DMA value | | 5 day DMA | 147.35 | | 12 day DMA | 144.3 | | 20 day DMA | 132.29 | | 35 day DMA | 111.21 | | 50 day DMA | 102.38 | | 100 day DMA | 71.62 | | 150 day DMA | 53.06 | | 200 day DMA | 44.23 | EMA (exponential moving average) of R R 511626
| EMA period | EMA current | EMA prev | EMA prev2 | | 5 day EMA | 150.56 | 144.82 | 140.05 | | 12 day EMA | 141.35 | 137.59 | 134.54 | | 20 day EMA | 132 | 128.84 | 126.16 | | 35 day EMA | 118.88 | 116.34 | 114.1 | | 50 day EMA | 104.06 | 101.69 | 99.54 |
SMA (simple moving average) of R R 511626
| SMA period | SMA current | SMA prev | SMA prev2 | | 5 day SMA | 147.35 | 140.34 | 136.2 | | 12 day SMA | 144.3 | 142.02 | 139.85 | | 20 day SMA | 132.29 | 128.75 | 125.37 | | 35 day SMA | 111.21 | 109.25 | 107.46 | | 50 day SMA | 102.38 | 100.53 | 98.81 | | 100 day SMA | 71.62 | 70.15 | 68.77 | | 150 day SMA | 53.06 | 52.08 | 51.16 | | 200 day SMA | 44.23 | 43.53 | 42.87 |
|
|
