RegencyTrus 511585 full analysis,charts,indicators,moving averages,SMA,DMA,EMA,ADX,MACD,RSIRegency Trus 511585 WideScreen charts, DMA,SMA,EMA technical analysis, forecast prediction, by indicators ADX,MACD,RSI,CCI BSE stock exchange
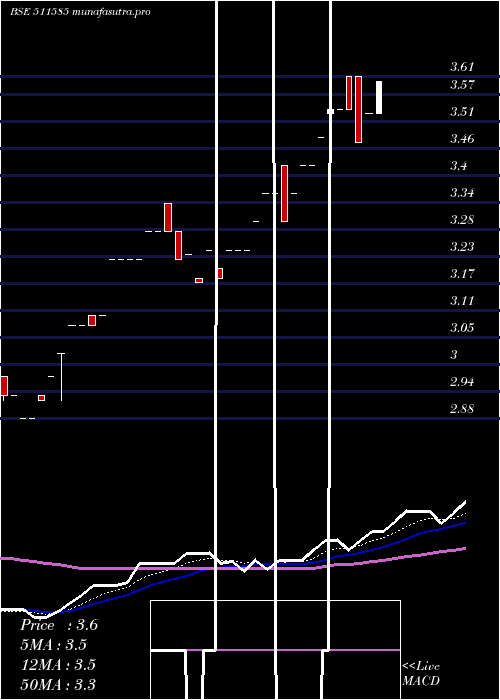
Daily price and charts and targets RegencyTrus Strong Daily Stock price targets for RegencyTrus 511585 are 3.3 and 3.3 | Daily Target 1 | 3.3 | | Daily Target 2 | 3.3 | | Daily Target 3 | 3.3 | | Daily Target 4 | 3.3 | | Daily Target 5 | 3.3 |
Daily price and volume Regency Trus
| Date |
Closing |
Open |
Range |
Volume |
Wed 16 July 2025 |
3.30 (1.85%) |
3.30 |
3.30 - 3.30 |
0.6672 times |
Tue 15 July 2025 |
3.24 (1.89%) |
3.24 |
3.24 - 3.24 |
0.0984 times |
Mon 14 July 2025 |
3.18 (1.92%) |
3.18 |
3.18 - 3.18 |
2.4571 times |
Fri 11 July 2025 |
3.12 (1.96%) |
3.12 |
3.12 - 3.12 |
0.0029 times |
Thu 10 July 2025 |
3.06 (2%) |
3.06 |
3.06 - 3.06 |
0.2895 times |
Wed 09 July 2025 |
3.00 (1.69%) |
3.00 |
3.00 - 3.00 |
0.1316 times |
Tue 08 July 2025 |
2.95 (1.72%) |
2.90 |
2.90 - 2.95 |
0.0956 times |
Mon 07 July 2025 |
2.90 (0%) |
2.90 |
2.90 - 2.90 |
0.4446 times |
Fri 04 July 2025 |
2.90 (-1.69%) |
2.94 |
2.90 - 2.94 |
2.0926 times |
Thu 03 July 2025 |
2.95 (-1.99%) |
3.01 |
2.95 - 3.01 |
3.7205 times |
Wed 02 July 2025 |
3.01 (1.69%) |
2.91 |
2.91 - 3.01 |
7.5841 times |
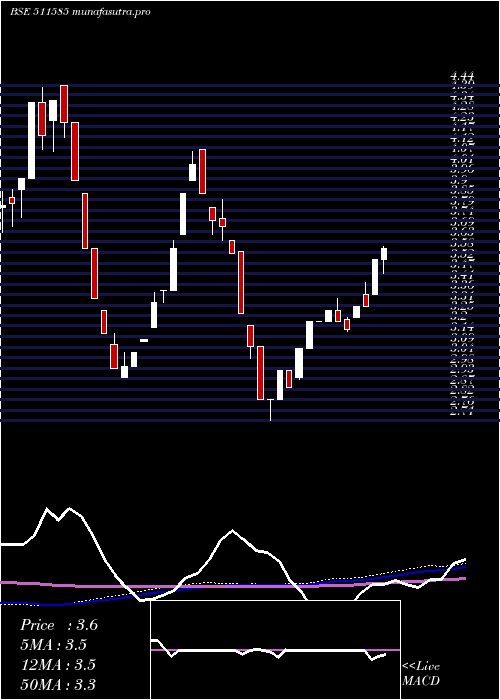
Weekly price and charts RegencyTrus Strong weekly Stock price targets for RegencyTrus 511585 are 3.24 and 3.36 | Weekly Target 1 | 3.14 | | Weekly Target 2 | 3.22 | | Weekly Target 3 | 3.26 | | Weekly Target 4 | 3.34 | | Weekly Target 5 | 3.38 |
Weekly price and volumes for Regency Trus
| Date |
Closing |
Open |
Range |
Volume |
Wed 16 July 2025 |
3.30 (5.77%) |
3.18 |
3.18 - 3.30 |
0.7299 times |
Fri 11 July 2025 |
3.12 (7.59%) |
2.90 |
2.90 - 3.12 |
0.2184 times |
Fri 04 July 2025 |
2.90 (-5.84%) |
3.02 |
2.90 - 3.02 |
3.6938 times |
Fri 27 June 2025 |
3.08 (-10.47%) |
3.32 |
3.08 - 3.32 |
0.7678 times |
Thu 19 June 2025 |
3.44 (-6.01%) |
3.59 |
3.44 - 3.59 |
0.047 times |
Fri 13 June 2025 |
3.66 (-5.67%) |
3.88 |
3.66 - 3.88 |
0.5705 times |
Fri 06 June 2025 |
3.88 (0%) |
3.95 |
3.88 - 4.02 |
1.0966 times |
Fri 30 May 2025 |
3.88 (7.78%) |
3.67 |
3.67 - 3.88 |
2.2354 times |
Fri 23 May 2025 |
3.60 (1.69%) |
3.54 |
3.47 - 3.61 |
0.5657 times |
Fri 16 May 2025 |
3.54 (7.27%) |
3.36 |
3.36 - 3.54 |
0.075 times |
Fri 09 May 2025 |
3.30 (0%) |
3.36 |
3.30 - 3.42 |
0.3377 times |
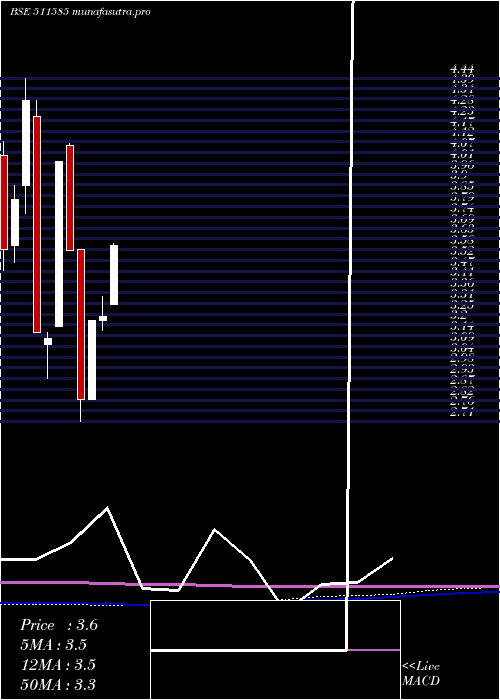
Monthly price and charts RegencyTrus Strong monthly Stock price targets for RegencyTrus 511585 are 3.1 and 3.5 | Monthly Target 1 | 2.77 | | Monthly Target 2 | 3.03 | | Monthly Target 3 | 3.1666666666667 | | Monthly Target 4 | 3.43 | | Monthly Target 5 | 3.57 |
Monthly price and volumes Regency Trus
| Date |
Closing |
Open |
Range |
Volume |
Wed 16 July 2025 |
3.30 (9.27%) |
2.96 |
2.90 - 3.30 |
0.6055 times |
Mon 30 June 2025 |
3.02 (-22.16%) |
3.95 |
3.02 - 4.02 |
0.4309 times |
Fri 30 May 2025 |
3.88 (19.75%) |
3.30 |
3.30 - 3.88 |
0.4704 times |
Wed 30 April 2025 |
3.24 (0.62%) |
3.22 |
3.17 - 3.34 |
0.313 times |
Fri 28 March 2025 |
3.22 (14.18%) |
2.82 |
2.82 - 3.22 |
2.3103 times |
Fri 28 February 2025 |
2.82 (-21.01%) |
3.58 |
2.71 - 3.58 |
0.7421 times |
Fri 31 January 2025 |
3.57 (-11.19%) |
4.10 |
3.57 - 4.11 |
1.0666 times |
Tue 31 December 2024 |
4.02 (28.43%) |
3.19 |
3.19 - 4.02 |
0.8178 times |
Fri 29 November 2024 |
3.13 (-0.95%) |
3.10 |
2.93 - 3.16 |
1.8292 times |
Thu 31 October 2024 |
3.16 (-27.02%) |
4.25 |
3.16 - 4.33 |
1.4144 times |
Mon 30 September 2024 |
4.33 (13.05%) |
3.90 |
3.76 - 4.44 |
2.7095 times |
DMA SMA EMA moving averages of Regency Trus 511585
DMA (daily moving average) of Regency Trus 511585
| DMA period | DMA value | | 5 day DMA | 3.18 | | 12 day DMA | 3.05 | | 20 day DMA | 3.13 | | 35 day DMA | 3.42 | | 50 day DMA | 3.44 | | 100 day DMA | 3.27 | | 150 day DMA | 3.36 | | 200 day DMA | 3.47 | EMA (exponential moving average) of Regency Trus 511585
| EMA period | EMA current | EMA prev | EMA prev2 | | 5 day EMA | 3.19 | 3.14 | 3.09 | | 12 day EMA | 3.15 | 3.12 | 3.1 | | 20 day EMA | 3.19 | 3.18 | 3.17 | | 35 day EMA | 3.26 | 3.26 | 3.26 | | 50 day EMA | 3.4 | 3.4 | 3.41 |
SMA (simple moving average) of Regency Trus 511585
| SMA period | SMA current | SMA prev | SMA prev2 | | 5 day SMA | 3.18 | 3.12 | 3.06 | | 12 day SMA | 3.05 | 3.02 | 3.01 | | 20 day SMA | 3.13 | 3.14 | 3.16 | | 35 day SMA | 3.42 | 3.44 | 3.45 | | 50 day SMA | 3.44 | 3.44 | 3.44 | | 100 day SMA | 3.27 | 3.27 | 3.27 | | 150 day SMA | 3.36 | 3.36 | 3.36 | | 200 day SMA | 3.47 | 3.48 | 3.48 |
|
|
