TimesGuaran 511559 full analysis,charts,indicators,moving averages,SMA,DMA,EMA,ADX,MACD,RSITimes Guaran 511559 WideScreen charts, DMA,SMA,EMA technical analysis, forecast prediction, by indicators ADX,MACD,RSI,CCI BSE stock exchange
Daily price and charts and targets TimesGuaran Strong Daily Stock price targets for TimesGuaran 511559 are 277.98 and 290.98 | Daily Target 1 | 268.98 | | Daily Target 2 | 273.97 | | Daily Target 3 | 281.98333333333 | | Daily Target 4 | 286.97 | | Daily Target 5 | 294.98 |
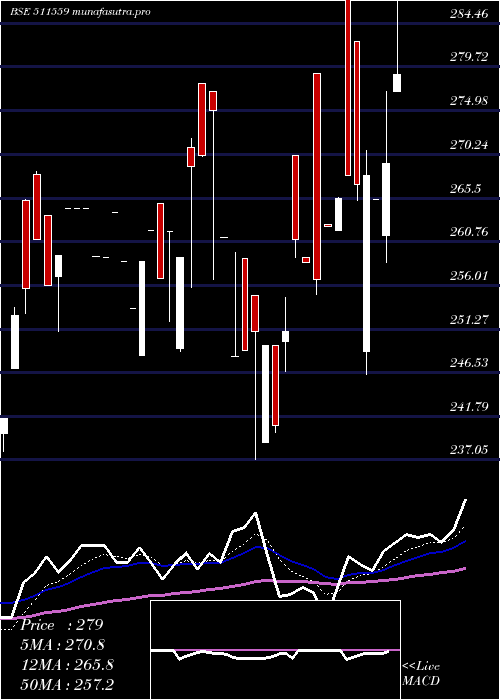
Daily price and volume Times Guaran
| Date |
Closing |
Open |
Range |
Volume |
Fri 05 December 2025 |
278.95 (3.62%) |
277.00 |
277.00 - 290.00 |
0.7128 times |
Thu 04 December 2025 |
269.20 (1.45%) |
261.45 |
258.50 - 277.00 |
0.8295 times |
Wed 03 December 2025 |
265.35 (-0.97%) |
265.35 |
265.35 - 265.35 |
0.0083 times |
Mon 01 December 2025 |
267.95 (0.37%) |
248.85 |
246.35 - 270.65 |
0.3376 times |
Fri 28 November 2025 |
266.95 (-0.35%) |
282.50 |
265.25 - 282.50 |
0.0167 times |
Thu 27 November 2025 |
267.90 (0.94%) |
289.00 |
267.90 - 289.00 |
0.0083 times |
Wed 26 November 2025 |
265.40 (1.12%) |
262.00 |
262.00 - 265.60 |
0.5002 times |
Tue 25 November 2025 |
262.45 (2.28%) |
262.60 |
262.40 - 262.60 |
2.2926 times |
Mon 24 November 2025 |
256.60 (-0.74%) |
279.00 |
255.00 - 279.00 |
4.4185 times |
Fri 21 November 2025 |
258.50 (-0.96%) |
259.00 |
258.50 - 259.00 |
0.8754 times |
Thu 20 November 2025 |
261.00 (3.98%) |
270.15 |
259.00 - 270.15 |
0.2001 times |
Weekly price and charts TimesGuaran Strong weekly Stock price targets for TimesGuaran 511559 are 262.65 and 306.3 | Weekly Target 1 | 228.12 | | Weekly Target 2 | 253.53 | | Weekly Target 3 | 271.76666666667 | | Weekly Target 4 | 297.18 | | Weekly Target 5 | 315.42 |
Weekly price and volumes for Times Guaran
| Date |
Closing |
Open |
Range |
Volume |
Fri 05 December 2025 |
278.95 (4.5%) |
248.85 |
246.35 - 290.00 |
0.5397 times |
Fri 28 November 2025 |
266.95 (3.27%) |
279.00 |
255.00 - 289.00 |
2.0684 times |
Fri 21 November 2025 |
258.50 (3.63%) |
249.45 |
240.00 - 270.15 |
0.504 times |
Fri 14 November 2025 |
249.45 (-9.29%) |
261.25 |
237.05 - 261.25 |
0.8424 times |
Fri 07 November 2025 |
275.00 (5.02%) |
249.15 |
248.80 - 277.95 |
1.8956 times |
Fri 31 October 2025 |
261.85 (3.29%) |
248.45 |
248.45 - 264.95 |
0.1251 times |
Wed 15 October 2025 |
253.50 (-2.12%) |
263.90 |
253.50 - 263.90 |
0.0143 times |
Fri 10 October 2025 |
259.00 (-2.04%) |
264.40 |
259.00 - 264.40 |
0.1227 times |
Wed 01 October 2025 |
264.40 (3.28%) |
257.00 |
251.00 - 264.40 |
0.1906 times |
Fri 26 September 2025 |
256.00 (11.26%) |
239.90 |
237.95 - 268.40 |
3.6971 times |
Fri 19 September 2025 |
230.10 (-9.27%) |
251.05 |
218.00 - 251.05 |
5.7429 times |
Monthly price and charts TimesGuaran Strong monthly Stock price targets for TimesGuaran 511559 are 262.65 and 306.3 | Monthly Target 1 | 228.12 | | Monthly Target 2 | 253.53 | | Monthly Target 3 | 271.76666666667 | | Monthly Target 4 | 297.18 | | Monthly Target 5 | 315.42 |
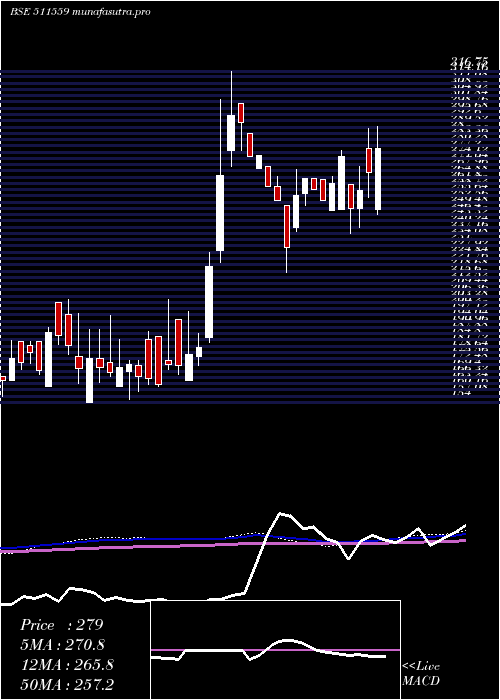
Monthly price and volumes Times Guaran
| Date |
Closing |
Open |
Range |
Volume |
Fri 05 December 2025 |
278.95 (4.5%) |
248.85 |
246.35 - 290.00 |
0.0112 times |
Fri 28 November 2025 |
266.95 (1.95%) |
249.15 |
237.05 - 289.00 |
0.1099 times |
Fri 31 October 2025 |
261.85 (-0.96%) |
264.40 |
248.45 - 264.95 |
0.0055 times |
Tue 30 September 2025 |
264.40 (-3.99%) |
269.90 |
218.00 - 269.90 |
0.2502 times |
Fri 29 August 2025 |
275.40 (7.77%) |
256.00 |
243.05 - 316.75 |
0.5965 times |
Thu 31 July 2025 |
255.55 (44.42%) |
178.35 |
165.00 - 302.85 |
6.0522 times |
Mon 30 June 2025 |
176.95 (2.34%) |
172.00 |
159.60 - 204.85 |
0.8279 times |
Fri 30 May 2025 |
172.90 (-1.12%) |
179.00 |
155.25 - 196.95 |
0.7256 times |
Wed 30 April 2025 |
174.85 (2.91%) |
162.00 |
154.00 - 204.80 |
1.2661 times |
Fri 28 March 2025 |
169.90 (2.97%) |
165.00 |
165.00 - 184.70 |
0.1549 times |
Fri 28 February 2025 |
165.00 (-7.3%) |
175.50 |
157.00 - 189.00 |
1.2253 times |

DMA SMA EMA moving averages of Times Guaran 511559
DMA (daily moving average) of Times Guaran 511559
| DMA period | DMA value | | 5 day DMA | 269.68 | | 12 day DMA | 264.27 | | 20 day DMA | 260.8 | | 35 day DMA | 260.85 | | 50 day DMA | 257.34 | | 100 day DMA | 242.21 | | 150 day DMA | 219.08 | | 200 day DMA | 207.44 | EMA (exponential moving average) of Times Guaran 511559
| EMA period | EMA current | EMA prev | EMA prev2 | | 5 day EMA | 270.78 | 266.69 | 265.44 | | 12 day EMA | 265.78 | 263.39 | 262.33 | | 20 day EMA | 263.23 | 261.58 | 260.78 | | 35 day EMA | 260.68 | 259.6 | 259.04 | | 50 day EMA | 259.47 | 258.68 | 258.25 |
SMA (simple moving average) of Times Guaran 511559
| SMA period | SMA current | SMA prev | SMA prev2 | | 5 day SMA | 269.68 | 267.47 | 266.71 | | 12 day SMA | 264.27 | 261.09 | 259.44 | | 20 day SMA | 260.8 | 260.3 | 259.79 | | 35 day SMA | 260.85 | 260.2 | 259.96 | | 50 day SMA | 257.34 | 256.97 | 256.87 | | 100 day SMA | 242.21 | 241.04 | 240.02 | | 150 day SMA | 219.08 | 218.35 | 217.68 | | 200 day SMA | 207.44 | 206.91 | 206.43 |
|
|
