GsbFinance 511543 full analysis,charts,indicators,moving averages,SMA,DMA,EMA,ADX,MACD,RSIGsb Finance 511543 WideScreen charts, DMA,SMA,EMA technical analysis, forecast prediction, by indicators ADX,MACD,RSI,CCI BSE stock exchange
Daily price and charts and targets GsbFinance Strong Daily Stock price targets for GsbFinance 511543 are 39.02 and 41.13 | Daily Target 1 | 37.35 | | Daily Target 2 | 38.57 | | Daily Target 3 | 39.463333333333 | | Daily Target 4 | 40.68 | | Daily Target 5 | 41.57 |
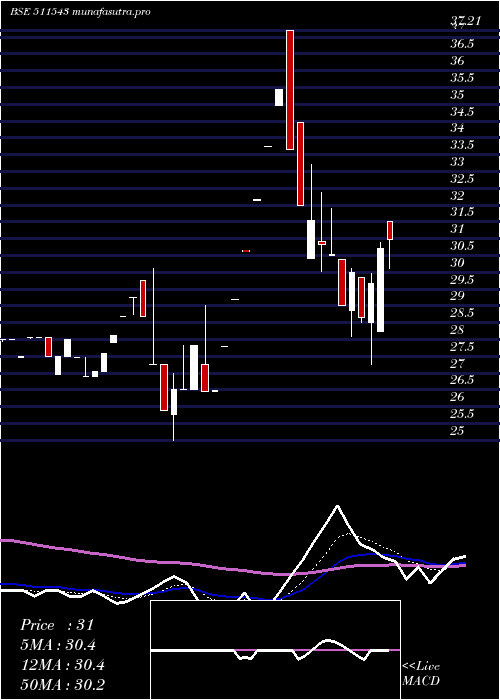
Daily price and volume Gsb Finance
| Date |
Closing |
Open |
Range |
Volume |
Tue 21 October 2025 |
39.78 (3.49%) |
38.44 |
38.25 - 40.36 |
0.2888 times |
Mon 20 October 2025 |
38.44 (4.54%) |
35.00 |
35.00 - 38.60 |
0.4129 times |
Fri 17 October 2025 |
36.77 (4.34%) |
36.95 |
33.48 - 37.00 |
2.877 times |
Thu 16 October 2025 |
35.24 (-4.21%) |
37.99 |
34.96 - 38.59 |
1.2899 times |
Wed 15 October 2025 |
36.79 (-4.98%) |
38.72 |
36.79 - 38.72 |
0.8305 times |
Tue 14 October 2025 |
38.72 (-4.98%) |
38.72 |
38.72 - 41.98 |
0.7427 times |
Mon 13 October 2025 |
40.75 (-4.99%) |
44.80 |
40.75 - 44.80 |
0.5411 times |
Fri 10 October 2025 |
42.89 (-4.94%) |
45.12 |
42.87 - 45.12 |
0.6865 times |
Thu 09 October 2025 |
45.12 (-4.99%) |
49.76 |
45.12 - 49.76 |
0.4968 times |
Wed 08 October 2025 |
47.49 (2.97%) |
45.20 |
43.82 - 47.85 |
1.8338 times |
Tue 07 October 2025 |
46.12 (-4.24%) |
45.80 |
45.80 - 49.29 |
1.4558 times |
Weekly price and charts GsbFinance Strong weekly Stock price targets for GsbFinance 511543 are 37.39 and 42.75 | Weekly Target 1 | 33.02 | | Weekly Target 2 | 36.4 | | Weekly Target 3 | 38.38 | | Weekly Target 4 | 41.76 | | Weekly Target 5 | 43.74 |
Weekly price and volumes for Gsb Finance
| Date |
Closing |
Open |
Range |
Volume |
Tue 21 October 2025 |
39.78 (8.19%) |
35.00 |
35.00 - 40.36 |
0.0572 times |
Fri 17 October 2025 |
36.77 (-14.27%) |
44.80 |
33.48 - 44.80 |
0.5119 times |
Fri 10 October 2025 |
42.89 (-6.84%) |
48.34 |
42.87 - 49.76 |
0.938 times |
Fri 03 October 2025 |
46.04 (15.68%) |
41.70 |
37.81 - 46.04 |
4.9221 times |
Fri 26 September 2025 |
39.80 (0.81%) |
41.40 |
39.31 - 45.69 |
1.1345 times |
Fri 19 September 2025 |
39.48 (36.8%) |
31.74 |
31.74 - 40.25 |
1.9537 times |
Fri 12 September 2025 |
28.86 (0.03%) |
28.80 |
25.21 - 30.08 |
0.0884 times |
Fri 05 September 2025 |
28.85 (-4.79%) |
28.65 |
26.80 - 28.99 |
0.0984 times |
Fri 29 August 2025 |
30.30 (8.25%) |
28.00 |
26.01 - 33.84 |
0.2436 times |
Fri 22 August 2025 |
27.99 (4.01%) |
26.78 |
26.10 - 30.70 |
0.0523 times |
Thu 14 August 2025 |
26.91 (-13.03%) |
30.30 |
26.02 - 30.30 |
0.2699 times |

Monthly price and charts GsbFinance Strong monthly Stock price targets for GsbFinance 511543 are 28.49 and 44.77 | Monthly Target 1 | 24.73 | | Monthly Target 2 | 32.25 | | Monthly Target 3 | 41.006666666667 | | Monthly Target 4 | 48.53 | | Monthly Target 5 | 57.29 |
Monthly price and volumes Gsb Finance
| Date |
Closing |
Open |
Range |
Volume |
Tue 21 October 2025 |
39.78 (-4.76%) |
43.85 |
33.48 - 49.76 |
0.6913 times |
Tue 30 September 2025 |
41.77 (37.85%) |
28.65 |
25.21 - 45.69 |
3.1939 times |
Fri 29 August 2025 |
30.30 (-1.34%) |
31.50 |
26.00 - 33.84 |
0.2536 times |
Thu 31 July 2025 |
30.71 (12.7%) |
27.25 |
25.00 - 37.21 |
0.5192 times |
Mon 30 June 2025 |
27.25 (-2.19%) |
27.31 |
26.91 - 30.10 |
0.1133 times |
Fri 30 May 2025 |
27.86 (-20.4%) |
34.99 |
25.84 - 36.60 |
0.4445 times |
Wed 30 April 2025 |
35.00 (2.37%) |
34.87 |
33.09 - 41.70 |
0.1225 times |
Fri 28 March 2025 |
34.19 (-18.24%) |
40.99 |
34.02 - 42.82 |
0.4127 times |
Fri 28 February 2025 |
41.82 (0.77%) |
38.64 |
31.59 - 42.67 |
0.766 times |
Fri 31 January 2025 |
41.50 (-14.82%) |
47.75 |
36.05 - 47.75 |
3.483 times |
Tue 31 December 2024 |
48.72 (99.18%) |
25.68 |
25.68 - 51.75 |
4.1362 times |

DMA SMA EMA moving averages of Gsb Finance 511543
DMA (daily moving average) of Gsb Finance 511543
| DMA period | DMA value | | 5 day DMA | 37.4 | | 12 day DMA | 41.36 | | 20 day DMA | 41.78 | | 35 day DMA | 37.57 | | 50 day DMA | 34.96 | | 100 day DMA | 31.91 | | 150 day DMA | 32.99 | | 200 day DMA | 35.07 | EMA (exponential moving average) of Gsb Finance 511543
| EMA period | EMA current | EMA prev | EMA prev2 | | 5 day EMA | 38.67 | 38.11 | 37.94 | | 12 day EMA | 39.73 | 39.72 | 39.95 | | 20 day EMA | 39.59 | 39.57 | 39.69 | | 35 day EMA | 37.7 | 37.58 | 37.53 | | 50 day EMA | 34.76 | 34.55 | 34.39 |
SMA (simple moving average) of Gsb Finance 511543
| SMA period | SMA current | SMA prev | SMA prev2 | | 5 day SMA | 37.4 | 37.19 | 37.65 | | 12 day SMA | 41.36 | 41.88 | 42.33 | | 20 day SMA | 41.78 | 41.87 | 41.92 | | 35 day SMA | 37.57 | 37.21 | 36.98 | | 50 day SMA | 34.96 | 34.73 | 34.52 | | 100 day SMA | 31.91 | 31.81 | 31.72 | | 150 day SMA | 32.99 | 33.01 | 33.03 | | 200 day SMA | 35.07 | 35.12 | 35.17 |
|
|
