SaharaHousg 511533 full analysis,charts,indicators,moving averages,SMA,DMA,EMA,ADX,MACD,RSISahara Housg 511533 WideScreen charts, DMA,SMA,EMA technical analysis, forecast prediction, by indicators ADX,MACD,RSI,CCI BSE stock exchange
Daily price and charts and targets SaharaHousg Strong Daily Stock price targets for SaharaHousg 511533 are 53.77 and 54.23 | Daily Target 1 | 53.39 | | Daily Target 2 | 53.69 | | Daily Target 3 | 53.846666666667 | | Daily Target 4 | 54.15 | | Daily Target 5 | 54.31 |
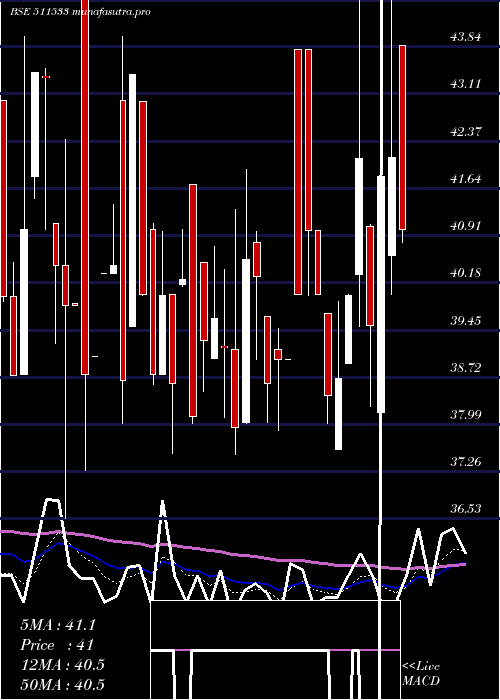
Daily price and volume Sahara Housg
| Date |
Closing |
Open |
Range |
Volume |
Tue 21 October 2025 |
54.00 (5%) |
53.80 |
53.54 - 54.00 |
0.3457 times |
Mon 20 October 2025 |
51.43 (4.98%) |
51.20 |
49.00 - 51.43 |
0.7677 times |
Fri 17 October 2025 |
48.99 (4.99%) |
48.99 |
48.66 - 48.99 |
1.7244 times |
Thu 16 October 2025 |
46.66 (5%) |
46.66 |
46.66 - 46.66 |
0.4355 times |
Wed 15 October 2025 |
44.44 (-2.78%) |
45.09 |
43.45 - 45.99 |
0.844 times |
Tue 14 October 2025 |
45.71 (-1.83%) |
46.00 |
44.24 - 47.49 |
0.4118 times |
Mon 13 October 2025 |
46.56 (-4.06%) |
46.11 |
46.11 - 48.70 |
0.4609 times |
Fri 10 October 2025 |
48.53 (-3.37%) |
49.22 |
47.71 - 49.22 |
1.0405 times |
Thu 09 October 2025 |
50.22 (-9.97%) |
58.00 |
50.21 - 58.00 |
2.502 times |
Wed 08 October 2025 |
55.78 (2.4%) |
56.00 |
53.56 - 57.50 |
1.4675 times |
Tue 07 October 2025 |
54.47 (-7.57%) |
63.48 |
53.10 - 64.82 |
11.0274 times |
Weekly price and charts SaharaHousg Strong weekly Stock price targets for SaharaHousg 511533 are 51.5 and 56.5 | Weekly Target 1 | 47.33 | | Weekly Target 2 | 50.67 | | Weekly Target 3 | 52.333333333333 | | Weekly Target 4 | 55.67 | | Weekly Target 5 | 57.33 |
Weekly price and volumes for Sahara Housg
| Date |
Closing |
Open |
Range |
Volume |
Tue 21 October 2025 |
54.00 (10.23%) |
51.20 |
49.00 - 54.00 |
0.2109 times |
Fri 17 October 2025 |
48.99 (0.95%) |
46.11 |
43.45 - 48.99 |
0.7343 times |
Fri 10 October 2025 |
48.53 (-9.43%) |
58.40 |
47.71 - 64.82 |
3.9768 times |
Fri 03 October 2025 |
53.58 (39.9%) |
39.11 |
39.11 - 53.58 |
3.835 times |
Fri 26 September 2025 |
38.30 (-8.02%) |
41.51 |
36.95 - 41.54 |
0.2912 times |
Fri 19 September 2025 |
41.64 (9.58%) |
38.76 |
37.25 - 43.50 |
0.2643 times |
Fri 12 September 2025 |
38.00 (-2.54%) |
38.99 |
36.57 - 41.30 |
0.142 times |
Fri 05 September 2025 |
38.99 (3.95%) |
38.00 |
37.20 - 41.00 |
0.2037 times |
Fri 29 August 2025 |
37.51 (-0.58%) |
38.60 |
37.00 - 39.00 |
0.1011 times |
Fri 22 August 2025 |
37.73 (-3.5%) |
38.70 |
37.42 - 40.00 |
0.2407 times |
Thu 14 August 2025 |
39.10 (0.13%) |
40.40 |
38.00 - 40.40 |
0.0442 times |

Monthly price and charts SaharaHousg Strong monthly Stock price targets for SaharaHousg 511533 are 48.5 and 70.32 | Monthly Target 1 | 32.12 | | Monthly Target 2 | 43.06 | | Monthly Target 3 | 53.94 | | Monthly Target 4 | 64.88 | | Monthly Target 5 | 75.76 |
Monthly price and volumes Sahara Housg
| Date |
Closing |
Open |
Range |
Volume |
Tue 21 October 2025 |
54.00 (21.02%) |
44.50 |
43.00 - 64.82 |
4.0548 times |
Tue 30 September 2025 |
44.62 (18.95%) |
38.00 |
36.57 - 46.00 |
1.7808 times |
Fri 29 August 2025 |
37.51 (-7.93%) |
40.74 |
37.00 - 40.80 |
0.3121 times |
Thu 31 July 2025 |
40.74 (2.36%) |
40.00 |
34.00 - 42.00 |
0.4682 times |
Mon 30 June 2025 |
39.80 (-1.97%) |
40.11 |
36.80 - 44.89 |
0.4887 times |
Fri 30 May 2025 |
40.60 (-0.98%) |
41.11 |
38.51 - 45.84 |
0.6624 times |
Wed 30 April 2025 |
41.00 (8.04%) |
38.02 |
37.60 - 47.95 |
0.9628 times |
Fri 28 March 2025 |
37.95 (-4.74%) |
39.86 |
37.29 - 45.71 |
0.2735 times |
Fri 28 February 2025 |
39.84 (-9.39%) |
43.20 |
36.53 - 47.00 |
0.5273 times |
Fri 31 January 2025 |
43.97 (6.62%) |
40.25 |
38.05 - 46.50 |
0.4696 times |
Tue 31 December 2024 |
41.24 (-2.83%) |
43.50 |
40.15 - 45.99 |
1.2788 times |

DMA SMA EMA moving averages of Sahara Housg 511533
DMA (daily moving average) of Sahara Housg 511533
| DMA period | DMA value | | 5 day DMA | 49.1 | | 12 day DMA | 50.48 | | 20 day DMA | 47.39 | | 35 day DMA | 43.74 | | 50 day DMA | 42.15 | | 100 day DMA | 41.25 | | 150 day DMA | 40.94 | | 200 day DMA | 41.16 | EMA (exponential moving average) of Sahara Housg 511533
| EMA period | EMA current | EMA prev | EMA prev2 | | 5 day EMA | 50.57 | 48.86 | 47.58 | | 12 day EMA | 49.01 | 48.1 | 47.5 | | 20 day EMA | 47.49 | 46.81 | 46.32 | | 35 day EMA | 45.29 | 44.78 | 44.39 | | 50 day EMA | 42.7 | 42.24 | 41.87 |
SMA (simple moving average) of Sahara Housg 511533
| SMA period | SMA current | SMA prev | SMA prev2 | | 5 day SMA | 49.1 | 47.45 | 46.47 | | 12 day SMA | 50.48 | 50.44 | 49.88 | | 20 day SMA | 47.39 | 46.63 | 46.14 | | 35 day SMA | 43.74 | 43.32 | 42.92 | | 50 day SMA | 42.15 | 41.86 | 41.64 | | 100 day SMA | 41.25 | 41.11 | 41.01 | | 150 day SMA | 40.94 | 40.84 | 40.76 | | 200 day SMA | 41.16 | 41.1 | 41.06 |
|
|
