IndBank 511473 full analysis,charts,indicators,moving averages,SMA,DMA,EMA,ADX,MACD,RSIInd Bank 511473 WideScreen charts, DMA,SMA,EMA technical analysis, forecast prediction, by indicators ADX,MACD,RSI,CCI BSE stock exchange
Daily price and charts and targets IndBank Strong Daily Stock price targets for IndBank 511473 are 34.73 and 35.85 | Daily Target 1 | 34.53 | | Daily Target 2 | 34.93 | | Daily Target 3 | 35.65 | | Daily Target 4 | 36.05 | | Daily Target 5 | 36.77 |
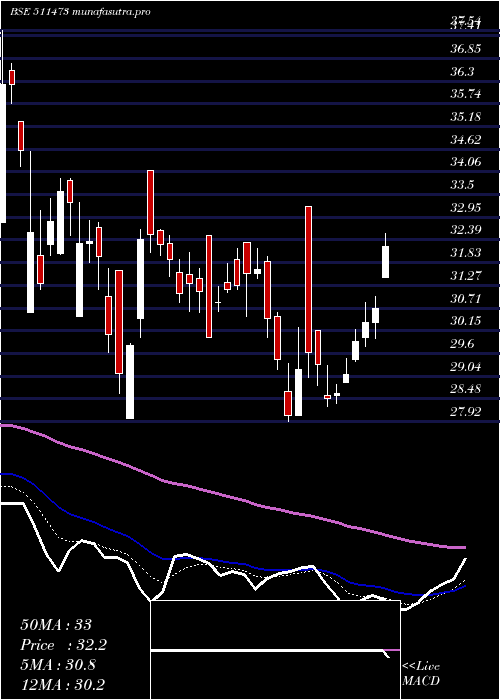
Daily price and volume Ind Bank
| Date |
Closing |
Open |
Range |
Volume |
Fri 05 December 2025 |
35.33 (0.2%) |
35.79 |
35.25 - 36.37 |
0.6294 times |
Thu 04 December 2025 |
35.26 (-1.65%) |
36.21 |
35.26 - 36.40 |
0.6105 times |
Wed 03 December 2025 |
35.85 (-0.75%) |
36.35 |
35.67 - 36.74 |
1.6569 times |
Tue 02 December 2025 |
36.12 (-0.25%) |
36.47 |
36.01 - 37.18 |
1.7111 times |
Mon 01 December 2025 |
36.21 (-1.44%) |
36.90 |
36.00 - 37.05 |
2.3576 times |
Fri 28 November 2025 |
36.74 (0.6%) |
33.00 |
33.00 - 36.90 |
0.8692 times |
Thu 27 November 2025 |
36.52 (0.61%) |
37.20 |
36.42 - 37.20 |
0.0855 times |
Wed 26 November 2025 |
36.30 (0.89%) |
36.75 |
36.08 - 37.00 |
0.9201 times |
Tue 25 November 2025 |
35.98 (-1.99%) |
36.45 |
35.37 - 36.93 |
0.2638 times |
Mon 24 November 2025 |
36.71 (-2.63%) |
37.32 |
36.45 - 38.30 |
0.8958 times |
Fri 21 November 2025 |
37.70 (-0.87%) |
38.30 |
37.35 - 38.30 |
1.2134 times |
Weekly price and charts IndBank Strong weekly Stock price targets for IndBank 511473 are 34.33 and 36.26 | Weekly Target 1 | 33.99 | | Weekly Target 2 | 34.66 | | Weekly Target 3 | 35.92 | | Weekly Target 4 | 36.59 | | Weekly Target 5 | 37.85 |
Weekly price and volumes for Ind Bank
| Date |
Closing |
Open |
Range |
Volume |
Fri 05 December 2025 |
35.33 (-3.84%) |
36.90 |
35.25 - 37.18 |
0.2218 times |
Fri 28 November 2025 |
36.74 (-2.55%) |
37.32 |
33.00 - 38.30 |
0.0966 times |
Fri 21 November 2025 |
37.70 (2.5%) |
38.00 |
36.85 - 38.49 |
0.1213 times |
Fri 14 November 2025 |
36.78 (-4.64%) |
38.76 |
36.55 - 39.10 |
0.1485 times |
Fri 07 November 2025 |
38.57 (-4.88%) |
40.55 |
37.80 - 42.10 |
0.4353 times |
Fri 31 October 2025 |
40.55 (-1.77%) |
40.00 |
39.00 - 42.00 |
0.2416 times |
Thu 23 October 2025 |
41.28 (1.47%) |
40.49 |
39.30 - 42.49 |
0.3073 times |
Fri 17 October 2025 |
40.68 (-6.35%) |
43.87 |
39.48 - 43.87 |
0.2557 times |
Fri 10 October 2025 |
43.44 (31.96%) |
34.00 |
34.00 - 47.00 |
8.0298 times |
Fri 03 October 2025 |
32.92 (1.23%) |
32.49 |
31.01 - 33.60 |
0.1421 times |
Fri 26 September 2025 |
32.52 (-3.16%) |
33.75 |
31.76 - 34.00 |
0.6407 times |

Monthly price and charts IndBank Strong monthly Stock price targets for IndBank 511473 are 34.33 and 36.26 | Monthly Target 1 | 33.99 | | Monthly Target 2 | 34.66 | | Monthly Target 3 | 35.92 | | Monthly Target 4 | 36.59 | | Monthly Target 5 | 37.85 |
Monthly price and volumes Ind Bank
| Date |
Closing |
Open |
Range |
Volume |
Fri 05 December 2025 |
35.33 (-3.84%) |
36.90 |
35.25 - 37.18 |
0.0816 times |
Fri 28 November 2025 |
36.74 (-9.4%) |
40.55 |
33.00 - 42.10 |
0.2949 times |
Fri 31 October 2025 |
40.55 (22.4%) |
32.55 |
32.55 - 47.00 |
3.281 times |
Tue 30 September 2025 |
33.13 (-5.42%) |
35.99 |
31.01 - 35.99 |
0.8302 times |
Fri 29 August 2025 |
35.03 (5.64%) |
34.90 |
31.00 - 36.40 |
0.7761 times |
Thu 31 July 2025 |
33.16 (-5.39%) |
35.05 |
32.25 - 36.85 |
0.5948 times |
Mon 30 June 2025 |
35.05 (-0.03%) |
36.86 |
32.01 - 37.80 |
1.0538 times |
Fri 30 May 2025 |
35.06 (4.31%) |
33.79 |
30.00 - 37.90 |
1.0483 times |
Wed 30 April 2025 |
33.61 (19.78%) |
28.06 |
28.06 - 39.40 |
1.1865 times |
Fri 28 March 2025 |
28.06 (-6.68%) |
31.64 |
27.92 - 34.10 |
0.8529 times |
Fri 28 February 2025 |
30.07 (-22.4%) |
38.70 |
29.62 - 39.80 |
0.5323 times |

DMA SMA EMA moving averages of Ind Bank 511473
DMA (daily moving average) of Ind Bank 511473
| DMA period | DMA value | | 5 day DMA | 35.75 | | 12 day DMA | 36.4 | | 20 day DMA | 36.87 | | 35 day DMA | 38.38 | | 50 day DMA | 37.85 | | 100 day DMA | 35.61 | | 150 day DMA | 35.2 | | 200 day DMA | 34.51 | EMA (exponential moving average) of Ind Bank 511473
| EMA period | EMA current | EMA prev | EMA prev2 | | 5 day EMA | 35.7 | 35.89 | 36.21 | | 12 day EMA | 36.31 | 36.49 | 36.71 | | 20 day EMA | 36.8 | 36.95 | 37.13 | | 35 day EMA | 36.95 | 37.05 | 37.16 | | 50 day EMA | 37.25 | 37.33 | 37.41 |
SMA (simple moving average) of Ind Bank 511473
| SMA period | SMA current | SMA prev | SMA prev2 | | 5 day SMA | 35.75 | 36.04 | 36.29 | | 12 day SMA | 36.4 | 36.58 | 36.74 | | 20 day SMA | 36.87 | 37.06 | 37.29 | | 35 day SMA | 38.38 | 38.59 | 38.82 | | 50 day SMA | 37.85 | 37.82 | 37.76 | | 100 day SMA | 35.61 | 35.61 | 35.61 | | 150 day SMA | 35.2 | 35.19 | 35.19 | | 200 day SMA | 34.51 | 34.52 | 34.54 |
|
|
