GujCredit 511441 full analysis,charts,indicators,moving averages,SMA,DMA,EMA,ADX,MACD,RSIGuj Credit 511441 WideScreen charts, DMA,SMA,EMA technical analysis, forecast prediction, by indicators ADX,MACD,RSI,CCI BSE stock exchange
Daily price and charts and targets GujCredit Strong Daily Stock price targets for GujCredit 511441 are 25.65 and 25.65 | Daily Target 1 | 25.65 | | Daily Target 2 | 25.65 | | Daily Target 3 | 25.65 | | Daily Target 4 | 25.65 | | Daily Target 5 | 25.65 |
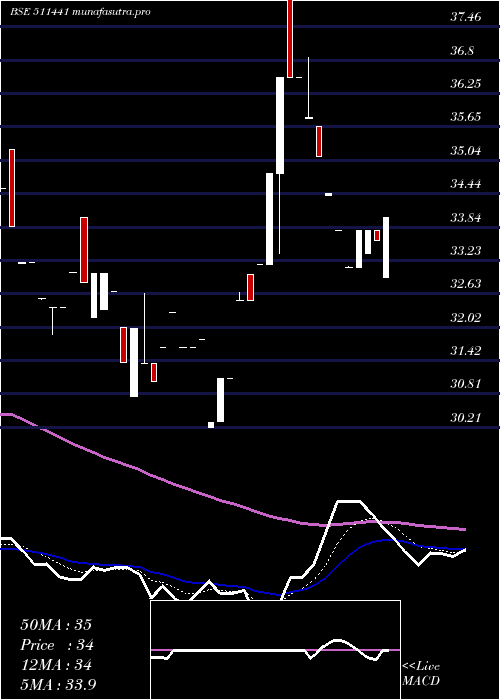
Daily price and volume Guj Credit
| Date |
Closing |
Open |
Range |
Volume |
Thu 23 October 2025 |
25.65 (-5%) |
25.65 |
25.65 - 25.65 |
0.0685 times |
Tue 21 October 2025 |
27.00 (-2.32%) |
27.00 |
27.00 - 27.00 |
0.0128 times |
Mon 20 October 2025 |
27.64 (0.47%) |
27.64 |
27.64 - 27.64 |
2.2679 times |
Fri 17 October 2025 |
27.51 (5%) |
27.51 |
27.51 - 27.51 |
0.0342 times |
Thu 16 October 2025 |
26.20 (-2.96%) |
27.20 |
26.20 - 27.20 |
1.9298 times |
Tue 14 October 2025 |
27.00 (0%) |
27.00 |
27.00 - 27.00 |
2.4219 times |
Thu 09 October 2025 |
27.00 (0%) |
27.00 |
27.00 - 27.00 |
0.0171 times |
Wed 08 October 2025 |
27.00 (-0.04%) |
27.00 |
27.00 - 27.00 |
2.5674 times |
Tue 07 October 2025 |
27.01 (0%) |
27.01 |
27.01 - 27.01 |
0.0257 times |
Mon 06 October 2025 |
27.01 (-4.56%) |
27.00 |
27.00 - 27.01 |
0.6547 times |
Fri 03 October 2025 |
28.30 (-0.35%) |
28.30 |
28.30 - 28.30 |
0.0043 times |
Weekly price and charts GujCredit Strong weekly Stock price targets for GujCredit 511441 are 24.66 and 26.65 | Weekly Target 1 | 24.32 | | Weekly Target 2 | 24.99 | | Weekly Target 3 | 26.313333333333 | | Weekly Target 4 | 26.98 | | Weekly Target 5 | 28.3 |
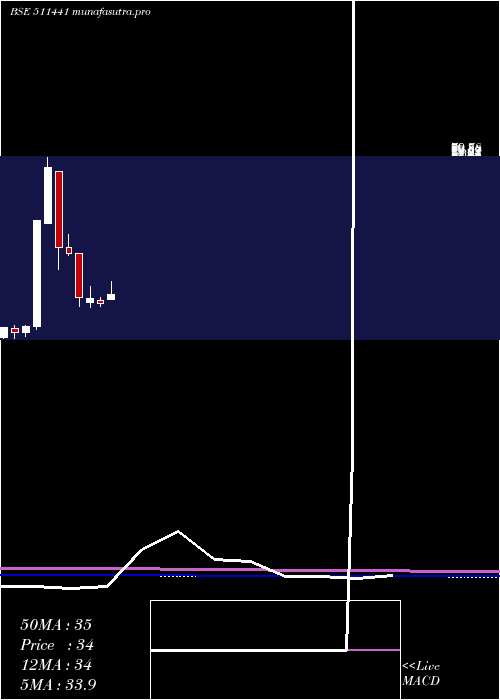
Weekly price and volumes for Guj Credit
| Date |
Closing |
Open |
Range |
Volume |
Thu 23 October 2025 |
25.65 (-6.76%) |
27.64 |
25.65 - 27.64 |
0.3946 times |
Fri 17 October 2025 |
27.51 (1.89%) |
27.00 |
26.20 - 27.51 |
0.7367 times |
Thu 09 October 2025 |
27.00 (-4.59%) |
27.00 |
27.00 - 27.01 |
0.5484 times |
Fri 03 October 2025 |
28.30 (-5.6%) |
29.98 |
28.30 - 29.98 |
0.0827 times |
Fri 26 September 2025 |
29.98 (10.63%) |
27.10 |
27.10 - 29.98 |
0.3428 times |
Fri 19 September 2025 |
27.10 (-3.42%) |
28.06 |
27.01 - 28.36 |
0.4154 times |
Fri 12 September 2025 |
28.06 (-4.88%) |
28.06 |
26.72 - 28.12 |
0.4959 times |
Fri 05 September 2025 |
29.50 (5.17%) |
30.85 |
28.15 - 33.93 |
6.5392 times |
Fri 29 August 2025 |
28.05 (2%) |
27.50 |
25.25 - 28.05 |
0.3953 times |
Fri 22 August 2025 |
27.50 (4.32%) |
26.36 |
25.02 - 27.60 |
0.0489 times |
Thu 14 August 2025 |
26.36 (-4.56%) |
27.62 |
26.00 - 28.55 |
0.6052 times |

Monthly price and charts GujCredit Strong monthly Stock price targets for GujCredit 511441 are 23.53 and 27.77 | Monthly Target 1 | 22.82 | | Monthly Target 2 | 24.24 | | Monthly Target 3 | 27.063333333333 | | Monthly Target 4 | 28.48 | | Monthly Target 5 | 31.3 |
Monthly price and volumes Guj Credit
| Date |
Closing |
Open |
Range |
Volume |
Thu 23 October 2025 |
25.65 (-14.19%) |
29.89 |
25.65 - 29.89 |
0.0996 times |
Tue 30 September 2025 |
29.89 (6.56%) |
30.85 |
26.72 - 33.93 |
0.4583 times |
Fri 29 August 2025 |
28.05 (-3.77%) |
28.00 |
25.02 - 30.69 |
0.0834 times |
Thu 31 July 2025 |
29.15 (-10.69%) |
32.80 |
26.39 - 33.65 |
0.7975 times |
Mon 30 June 2025 |
32.64 (-0.61%) |
32.20 |
30.57 - 37.13 |
0.5861 times |
Fri 30 May 2025 |
32.84 (5.59%) |
32.50 |
32.50 - 38.36 |
1.4852 times |
Wed 30 April 2025 |
31.10 (-5.3%) |
32.19 |
30.21 - 33.00 |
0.178 times |
Fri 28 March 2025 |
32.84 (-0.48%) |
31.35 |
29.80 - 36.73 |
5.8854 times |
Fri 28 February 2025 |
33.00 (-30.95%) |
47.70 |
29.99 - 47.70 |
0.3266 times |
Fri 31 January 2025 |
47.79 (-4.04%) |
49.85 |
47.32 - 54.21 |
0.0998 times |
Tue 31 December 2024 |
49.80 (-35.05%) |
75.15 |
42.51 - 75.15 |
2.7966 times |
DMA SMA EMA moving averages of Guj Credit 511441
DMA (daily moving average) of Guj Credit 511441
| DMA period | DMA value | | 5 day DMA | 26.8 | | 12 day DMA | 27.14 | | 20 day DMA | 27.62 | | 35 day DMA | 28.16 | | 50 day DMA | 27.88 | | 100 day DMA | 29.78 | | 150 day DMA | 30.81 | | 200 day DMA | 37.26 | EMA (exponential moving average) of Guj Credit 511441
| EMA period | EMA current | EMA prev | EMA prev2 | | 5 day EMA | 26.67 | 27.18 | 27.27 | | 12 day EMA | 27.13 | 27.4 | 27.47 | | 20 day EMA | 27.43 | 27.62 | 27.68 | | 35 day EMA | 27.66 | 27.78 | 27.83 | | 50 day EMA | 27.85 | 27.94 | 27.98 |
SMA (simple moving average) of Guj Credit 511441
| SMA period | SMA current | SMA prev | SMA prev2 | | 5 day SMA | 26.8 | 27.07 | 27.07 | | 12 day SMA | 27.14 | 27.5 | 27.62 | | 20 day SMA | 27.62 | 27.76 | 27.76 | | 35 day SMA | 28.16 | 28.16 | 28.12 | | 50 day SMA | 27.88 | 27.92 | 27.97 | | 100 day SMA | 29.78 | 29.87 | 29.96 | | 150 day SMA | 30.81 | 30.87 | 30.93 | | 200 day SMA | 37.26 | 37.47 | 37.66 |
|
|
