VlsFinance 511333 full analysis,charts,indicators,moving averages,SMA,DMA,EMA,ADX,MACD,RSIVls Finance 511333 WideScreen charts, DMA,SMA,EMA technical analysis, forecast prediction, by indicators ADX,MACD,RSI,CCI BSE stock exchange
Daily price and charts and targets VlsFinance Strong Daily Stock price targets for VlsFinance 511333 are 330.53 and 343.03 | Daily Target 1 | 321.15 | | Daily Target 2 | 327.4 | | Daily Target 3 | 333.65 | | Daily Target 4 | 339.9 | | Daily Target 5 | 346.15 |
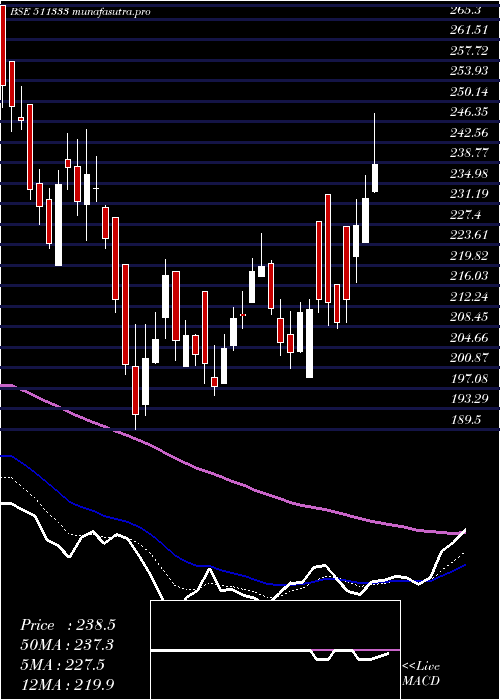
Daily price and volume Vls Finance
| Date |
Closing |
Open |
Range |
Volume |
Fri 05 December 2025 |
333.65 (1.85%) |
327.40 |
327.40 - 339.90 |
1.1051 times |
Thu 04 December 2025 |
327.60 (3.59%) |
318.10 |
318.10 - 329.00 |
0.8242 times |
Wed 03 December 2025 |
316.25 (1.62%) |
311.00 |
310.25 - 318.30 |
0.6041 times |
Tue 02 December 2025 |
311.20 (0.24%) |
308.10 |
308.10 - 313.55 |
0.3454 times |
Mon 01 December 2025 |
310.45 (0.57%) |
313.95 |
308.05 - 314.50 |
0.7143 times |
Fri 28 November 2025 |
308.70 (1.06%) |
306.00 |
305.65 - 309.80 |
0.3617 times |
Thu 27 November 2025 |
305.45 (0.58%) |
305.00 |
304.00 - 307.75 |
0.5197 times |
Wed 26 November 2025 |
303.70 (0.86%) |
297.00 |
297.00 - 305.30 |
0.3902 times |
Tue 25 November 2025 |
301.10 (-2.53%) |
314.80 |
293.85 - 314.80 |
0.9214 times |
Mon 24 November 2025 |
308.90 (17.23%) |
305.00 |
299.20 - 316.20 |
4.2138 times |
Fri 21 November 2025 |
263.50 (0.08%) |
268.45 |
261.35 - 268.45 |
0.7458 times |
Weekly price and charts VlsFinance Strong weekly Stock price targets for VlsFinance 511333 are 320.85 and 352.7 | Weekly Target 1 | 295.35 | | Weekly Target 2 | 314.5 | | Weekly Target 3 | 327.2 | | Weekly Target 4 | 346.35 | | Weekly Target 5 | 359.05 |
Weekly price and volumes for Vls Finance
| Date |
Closing |
Open |
Range |
Volume |
Fri 05 December 2025 |
333.65 (8.08%) |
313.95 |
308.05 - 339.90 |
1.8855 times |
Fri 28 November 2025 |
308.70 (17.15%) |
305.00 |
293.85 - 316.20 |
3.362 times |
Fri 21 November 2025 |
263.50 (26.17%) |
234.40 |
230.00 - 269.10 |
2.6754 times |
Fri 14 November 2025 |
208.85 (-1.93%) |
212.75 |
200.20 - 212.75 |
0.3805 times |
Fri 07 November 2025 |
212.95 (-2.14%) |
216.05 |
207.70 - 225.00 |
0.5199 times |
Fri 31 October 2025 |
217.60 (0.28%) |
218.00 |
210.55 - 221.10 |
0.1424 times |
Thu 23 October 2025 |
217.00 (2.43%) |
222.10 |
211.40 - 223.00 |
0.1426 times |
Fri 17 October 2025 |
211.85 (-3.18%) |
213.60 |
209.15 - 219.80 |
0.3634 times |
Fri 10 October 2025 |
218.80 (-0.73%) |
220.75 |
215.60 - 224.50 |
0.0951 times |
Fri 03 October 2025 |
220.40 (0.39%) |
210.15 |
210.15 - 224.95 |
0.4331 times |
Fri 26 September 2025 |
219.55 (-2.47%) |
230.35 |
219.00 - 230.35 |
0.3236 times |

Monthly price and charts VlsFinance Strong monthly Stock price targets for VlsFinance 511333 are 320.85 and 352.7 | Monthly Target 1 | 295.35 | | Monthly Target 2 | 314.5 | | Monthly Target 3 | 327.2 | | Monthly Target 4 | 346.35 | | Monthly Target 5 | 359.05 |
Monthly price and volumes Vls Finance
| Date |
Closing |
Open |
Range |
Volume |
Fri 05 December 2025 |
333.65 (8.08%) |
313.95 |
308.05 - 339.90 |
0.5385 times |
Fri 28 November 2025 |
308.70 (41.87%) |
216.05 |
200.20 - 316.20 |
1.9816 times |
Fri 31 October 2025 |
217.60 (1.12%) |
215.20 |
209.15 - 224.95 |
0.2828 times |
Tue 30 September 2025 |
215.20 (-2.76%) |
220.45 |
210.15 - 234.50 |
0.7178 times |
Fri 29 August 2025 |
221.30 (-5.29%) |
232.25 |
218.90 - 244.95 |
0.4664 times |
Thu 31 July 2025 |
233.65 (-6.39%) |
251.40 |
215.05 - 259.95 |
0.4884 times |
Mon 30 June 2025 |
249.60 (4.7%) |
238.50 |
235.90 - 264.45 |
0.486 times |
Fri 30 May 2025 |
238.40 (0.23%) |
241.05 |
211.15 - 273.25 |
1.079 times |
Wed 30 April 2025 |
237.85 (16.74%) |
203.80 |
199.00 - 279.00 |
1.3876 times |
Fri 28 March 2025 |
203.75 (-4.59%) |
219.90 |
189.50 - 225.65 |
2.5719 times |
Fri 28 February 2025 |
213.55 (-25.9%) |
275.25 |
211.00 - 323.90 |
1.5976 times |

DMA SMA EMA moving averages of Vls Finance 511333
DMA (daily moving average) of Vls Finance 511333
| DMA period | DMA value | | 5 day DMA | 319.83 | | 12 day DMA | 304.48 | | 20 day DMA | 270.31 | | 35 day DMA | 247.21 | | 50 day DMA | 239.33 | | 100 day DMA | 235.57 | | 150 day DMA | 239.24 | | 200 day DMA | 236.6 | EMA (exponential moving average) of Vls Finance 511333
| EMA period | EMA current | EMA prev | EMA prev2 | | 5 day EMA | 321.4 | 315.27 | 309.1 | | 12 day EMA | 301.55 | 295.71 | 289.91 | | 20 day EMA | 283.31 | 278.01 | 272.79 | | 35 day EMA | 263.65 | 259.53 | 255.52 | | 50 day EMA | 246.09 | 242.52 | 239.05 |
SMA (simple moving average) of Vls Finance 511333
| SMA period | SMA current | SMA prev | SMA prev2 | | 5 day SMA | 319.83 | 314.84 | 310.41 | | 12 day SMA | 304.48 | 298.2 | 291.79 | | 20 day SMA | 270.31 | 264.33 | 258.8 | | 35 day SMA | 247.21 | 243.9 | 240.79 | | 50 day SMA | 239.33 | 237.16 | 235.04 | | 100 day SMA | 235.57 | 234.75 | 234.02 | | 150 day SMA | 239.24 | 238.67 | 238.16 | | 200 day SMA | 236.6 | 236.36 | 236.16 |
|
|
