ShriramTran 511218 full analysis,charts,indicators,moving averages,SMA,DMA,EMA,ADX,MACD,RSIShriram Tran 511218 WideScreen charts, DMA,SMA,EMA technical analysis, forecast prediction, by indicators ADX,MACD,RSI,CCI BSE stock exchange
Daily price and charts and targets ShriramTran Strong Daily Stock price targets for ShriramTran 511218 are 702.8 and 724.95 | Daily Target 1 | 685.6 | | Daily Target 2 | 697.85 | | Daily Target 3 | 707.75 | | Daily Target 4 | 720 | | Daily Target 5 | 729.9 |
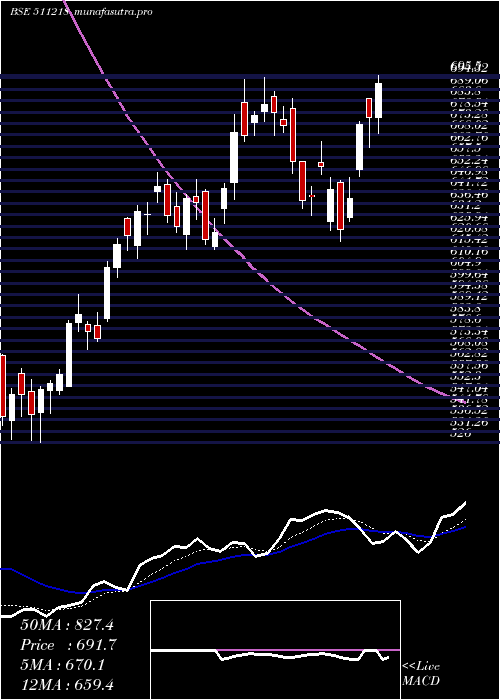
Daily price and volume Shriram Tran
| Date |
Closing |
Open |
Range |
Volume |
Thu 23 October 2025 |
710.10 (2.17%) |
697.85 |
695.50 - 717.65 |
1.7052 times |
Tue 21 October 2025 |
695.00 (0.12%) |
694.20 |
690.20 - 697.20 |
0.429 times |
Mon 20 October 2025 |
694.15 (2.77%) |
679.80 |
678.40 - 698.50 |
0.9354 times |
Fri 17 October 2025 |
675.45 (0.46%) |
670.90 |
670.55 - 679.65 |
0.4011 times |
Thu 16 October 2025 |
672.35 (-0.69%) |
677.95 |
662.25 - 679.35 |
1.6982 times |
Wed 15 October 2025 |
677.00 (0.41%) |
675.00 |
673.45 - 682.45 |
0.5912 times |
Tue 14 October 2025 |
674.25 (0.27%) |
675.75 |
666.95 - 681.00 |
0.7956 times |
Mon 13 October 2025 |
672.45 (1.08%) |
660.00 |
660.00 - 673.65 |
0.9914 times |
Fri 10 October 2025 |
665.25 (-0.61%) |
668.25 |
663.10 - 670.80 |
1.7059 times |
Thu 09 October 2025 |
669.30 (0.36%) |
666.90 |
662.00 - 671.80 |
0.7471 times |
Wed 08 October 2025 |
666.90 (0.01%) |
663.40 |
662.65 - 673.20 |
0.9789 times |
Weekly price and charts ShriramTran Strong weekly Stock price targets for ShriramTran 511218 are 694.25 and 733.5 | Weekly Target 1 | 662.8 | | Weekly Target 2 | 686.45 | | Weekly Target 3 | 702.05 | | Weekly Target 4 | 725.7 | | Weekly Target 5 | 741.3 |
Weekly price and volumes for Shriram Tran
| Date |
Closing |
Open |
Range |
Volume |
Thu 23 October 2025 |
710.10 (5.13%) |
679.80 |
678.40 - 717.65 |
0.436 times |
Fri 17 October 2025 |
675.45 (1.53%) |
660.00 |
660.00 - 682.45 |
0.636 times |
Fri 10 October 2025 |
665.25 (3.04%) |
645.85 |
645.85 - 675.50 |
1.2496 times |
Fri 03 October 2025 |
645.60 (6.58%) |
606.15 |
603.30 - 649.90 |
1.3072 times |
Fri 26 September 2025 |
605.75 (-4.38%) |
635.00 |
603.55 - 637.60 |
0.9969 times |
Fri 19 September 2025 |
633.50 (0.04%) |
636.25 |
613.55 - 637.40 |
0.7987 times |
Fri 12 September 2025 |
633.25 (6.73%) |
593.65 |
591.00 - 633.90 |
1.1743 times |
Fri 05 September 2025 |
593.30 (2.14%) |
580.85 |
578.60 - 597.90 |
1.2432 times |
Fri 29 August 2025 |
580.85 (-5.71%) |
622.00 |
566.40 - 624.25 |
1.3284 times |
Fri 22 August 2025 |
616.00 (-0.2%) |
624.10 |
612.70 - 637.25 |
0.8296 times |
Thu 14 August 2025 |
617.25 (1.27%) |
610.25 |
609.40 - 621.95 |
0.5702 times |

Monthly price and charts ShriramTran Strong monthly Stock price targets for ShriramTran 511218 are 662.7 and 765.05 | Monthly Target 1 | 578.67 | | Monthly Target 2 | 644.38 | | Monthly Target 3 | 681.01666666667 | | Monthly Target 4 | 746.73 | | Monthly Target 5 | 783.37 |
Monthly price and volumes Shriram Tran
| Date |
Closing |
Open |
Range |
Volume |
Thu 23 October 2025 |
710.10 (15.2%) |
615.40 |
615.30 - 717.65 |
1.1847 times |
Tue 30 September 2025 |
616.40 (6.12%) |
580.85 |
578.60 - 637.60 |
1.4739 times |
Fri 29 August 2025 |
580.85 (-7.95%) |
626.05 |
566.40 - 639.75 |
1.1974 times |
Thu 31 July 2025 |
631.00 (-10.65%) |
709.75 |
601.75 - 710.00 |
1.213 times |
Mon 30 June 2025 |
706.20 (10.42%) |
633.20 |
625.05 - 715.90 |
0.8616 times |
Fri 30 May 2025 |
639.55 (4.69%) |
614.30 |
593.75 - 684.05 |
0.8058 times |
Wed 30 April 2025 |
610.90 (-6.85%) |
655.85 |
596.10 - 717.40 |
0.994 times |
Fri 28 March 2025 |
655.85 (6.2%) |
629.50 |
611.00 - 694.30 |
0.8634 times |
Fri 28 February 2025 |
617.55 (13.56%) |
529.70 |
516.60 - 620.00 |
0.8512 times |
Fri 31 January 2025 |
543.80 (-81.19%) |
2932.95 |
493.60 - 3096.50 |
0.5551 times |
Tue 31 December 2024 |
2891.45 (-4.19%) |
3000.00 |
2854.00 - 3265.60 |
0.1216 times |

DMA SMA EMA moving averages of Shriram Tran 511218
DMA (daily moving average) of Shriram Tran 511218
| DMA period | DMA value | | 5 day DMA | 689.41 | | 12 day DMA | 678.25 | | 20 day DMA | 658.84 | | 35 day DMA | 639.3 | | 50 day DMA | 629.77 | | 100 day DMA | 644.89 | | 150 day DMA | 646.73 | | 200 day DMA | 755.42 | EMA (exponential moving average) of Shriram Tran 511218
| EMA period | EMA current | EMA prev | EMA prev2 | | 5 day EMA | 693.39 | 685.03 | 680.05 | | 12 day EMA | 678.15 | 672.34 | 668.22 | | 20 day EMA | 665.6 | 660.92 | 657.33 | | 35 day EMA | 649.9 | 646.36 | 643.5 | | 50 day EMA | 635.42 | 632.37 | 629.81 |
SMA (simple moving average) of Shriram Tran 511218
| SMA period | SMA current | SMA prev | SMA prev2 | | 5 day SMA | 689.41 | 682.79 | 678.64 | | 12 day SMA | 678.25 | 675.03 | 670.91 | | 20 day SMA | 658.84 | 654.78 | 651.4 | | 35 day SMA | 639.3 | 635.72 | 632.68 | | 50 day SMA | 629.77 | 627.76 | 626.4 | | 100 day SMA | 644.89 | 644.32 | 643.92 | | 150 day SMA | 646.73 | 646.29 | 645.87 | | 200 day SMA | 755.42 | 766.27 | 777.21 |
|
|
