IC 511194 full analysis,charts,indicators,moving averages,SMA,DMA,EMA,ADX,MACD,RSII C 511194 WideScreen charts, DMA,SMA,EMA technical analysis, forecast prediction, by indicators ADX,MACD,RSI,CCI BSE stock exchange
Daily price and charts and targets IC Strong Daily Stock price targets for IC 511194 are 51.49 and 51.49 | Daily Target 1 | 51.49 | | Daily Target 2 | 51.49 | | Daily Target 3 | 51.49 | | Daily Target 4 | 51.49 | | Daily Target 5 | 51.49 |
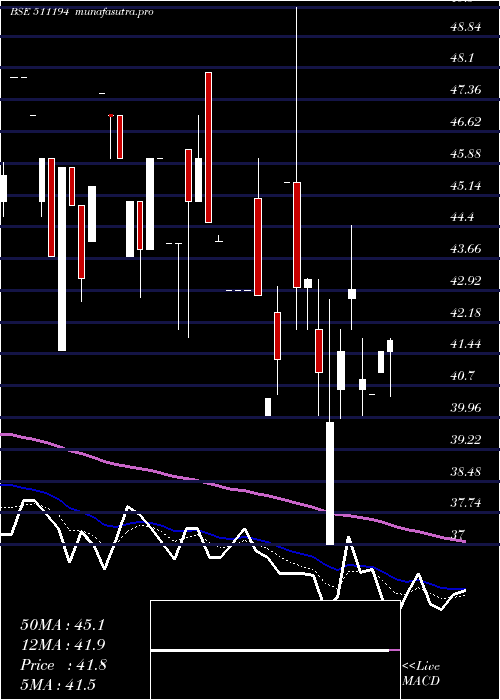
Daily price and volume I C
| Date |
Closing |
Open |
Range |
Volume |
Fri 05 December 2025 |
51.49 (9.55%) |
51.49 |
51.49 - 51.49 |
0.0038 times |
Mon 24 November 2025 |
47.00 (-2.04%) |
47.00 |
47.00 - 47.00 |
0.0077 times |
Thu 20 November 2025 |
47.98 (-2.06%) |
47.98 |
47.98 - 47.98 |
0.0038 times |
Mon 17 November 2025 |
48.99 (-0.02%) |
47.02 |
47.00 - 48.99 |
1.514 times |
Wed 12 November 2025 |
49.00 (0%) |
49.00 |
49.00 - 49.00 |
1.9164 times |
Fri 07 November 2025 |
49.00 (0%) |
49.00 |
49.00 - 49.00 |
1.9164 times |
Thu 06 November 2025 |
49.00 (0%) |
49.00 |
49.00 - 49.00 |
0.0038 times |
Mon 03 November 2025 |
49.00 (2.51%) |
48.59 |
47.80 - 49.00 |
0.0307 times |
Thu 30 October 2025 |
47.80 (-3.24%) |
48.00 |
47.80 - 48.00 |
0.3871 times |
Wed 29 October 2025 |
49.40 (-4.98%) |
49.40 |
49.40 - 49.40 |
4.2162 times |
Mon 27 October 2025 |
51.99 (1.25%) |
51.99 |
51.99 - 51.99 |
0.0383 times |
Weekly price and charts IC Strong weekly Stock price targets for IC 511194 are 49.25 and 53.74 | Weekly Target 1 | 45.5 | | Weekly Target 2 | 48.5 | | Weekly Target 3 | 49.993333333333 | | Weekly Target 4 | 52.99 | | Weekly Target 5 | 54.48 |
Weekly price and volumes for I C
| Date |
Closing |
Open |
Range |
Volume |
Fri 05 December 2025 |
51.49 (7.32%) |
47.00 |
47.00 - 51.49 |
0.0002 times |
Thu 20 November 2025 |
47.98 (-2.08%) |
47.02 |
47.00 - 48.99 |
0.0244 times |
Wed 12 November 2025 |
49.00 (0%) |
49.00 |
49.00 - 49.00 |
0.0308 times |
Fri 07 November 2025 |
49.00 (2.51%) |
48.59 |
47.80 - 49.00 |
0.0313 times |
Thu 30 October 2025 |
47.80 (-6.91%) |
51.99 |
47.80 - 51.99 |
0.0745 times |
Mon 20 October 2025 |
51.35 (0.98%) |
51.35 |
51.35 - 51.35 |
0.0001 times |
Fri 17 October 2025 |
50.85 (3.78%) |
49.98 |
49.55 - 52.00 |
0.0276 times |
Thu 09 October 2025 |
49.00 (-5.24%) |
49.13 |
49.00 - 51.58 |
0.1748 times |
Fri 03 October 2025 |
51.71 (0%) |
51.71 |
51.71 - 51.71 |
0.0025 times |
Fri 19 September 2025 |
51.71 (12.41%) |
47.90 |
47.15 - 52.39 |
9.6339 times |
Fri 12 September 2025 |
46.00 (-4.17%) |
47.98 |
46.00 - 47.98 |
0.0174 times |

Monthly price and charts IC Strong monthly Stock price targets for IC 511194 are 51.49 and 51.49 | Monthly Target 1 | 51.49 | | Monthly Target 2 | 51.49 | | Monthly Target 3 | 51.49 | | Monthly Target 4 | 51.49 | | Monthly Target 5 | 51.49 |
Monthly price and volumes I C
| Date |
Closing |
Open |
Range |
Volume |
Fri 05 December 2025 |
51.49 (9.55%) |
51.49 |
51.49 - 51.49 |
0 times |
Mon 24 November 2025 |
47.00 (-1.67%) |
48.59 |
47.00 - 49.00 |
0.031 times |
Thu 30 October 2025 |
47.80 (-7.56%) |
51.71 |
47.80 - 52.00 |
0.1 times |
Fri 19 September 2025 |
51.71 (10.02%) |
48.30 |
46.00 - 52.39 |
3.5105 times |
Fri 29 August 2025 |
47.00 (10.17%) |
42.60 |
41.01 - 50.40 |
0.0438 times |
Thu 31 July 2025 |
42.66 (-27.57%) |
57.12 |
42.51 - 57.68 |
0.1304 times |
Mon 30 June 2025 |
58.90 (1.55%) |
55.10 |
52.51 - 60.00 |
0.1861 times |
Fri 30 May 2025 |
58.00 (38.92%) |
41.50 |
37.70 - 58.00 |
0.91 times |
Wed 30 April 2025 |
41.75 (-2.73%) |
42.91 |
37.00 - 49.50 |
1.1718 times |
Fri 28 March 2025 |
42.92 (-1.78%) |
41.52 |
41.52 - 48.00 |
3.9164 times |
Fri 28 February 2025 |
43.70 (-20.43%) |
49.58 |
43.70 - 51.59 |
0.0922 times |

DMA SMA EMA moving averages of I C 511194
DMA (daily moving average) of I C 511194
| DMA period | DMA value | | 5 day DMA | 48.89 | | 12 day DMA | 49.33 | | 20 day DMA | 49.89 | | 35 day DMA | 49.54 | | 50 day DMA | 48.44 | | 100 day DMA | 50.2 | | 150 day DMA | 48.29 | | 200 day DMA | 50.42 | EMA (exponential moving average) of I C 511194
| EMA period | EMA current | EMA prev | EMA prev2 | | 5 day EMA | 49.26 | 48.15 | 48.73 | | 12 day EMA | 49.31 | 48.91 | 49.26 | | 20 day EMA | 49.37 | 49.15 | 49.38 | | 35 day EMA | 49.04 | 48.9 | 49.01 | | 50 day EMA | 48.53 | 48.41 | 48.47 |
SMA (simple moving average) of I C 511194
| SMA period | SMA current | SMA prev | SMA prev2 | | 5 day SMA | 48.89 | 48.39 | 48.79 | | 12 day SMA | 49.33 | 49.28 | 49.7 | | 20 day SMA | 49.89 | 49.77 | 50.01 | | 35 day SMA | 49.54 | 49.5 | 49.59 | | 50 day SMA | 48.44 | 48.37 | 48.39 | | 100 day SMA | 50.2 | 50.1 | 50.03 | | 150 day SMA | 48.29 | 48.29 | 48.3 | | 200 day SMA | 50.42 | 50.43 | 50.45 |
|
|
