MilgreyFin 511018 full analysis,charts,indicators,moving averages,SMA,DMA,EMA,ADX,MACD,RSIMilgrey Fin 511018 WideScreen charts, DMA,SMA,EMA technical analysis, forecast prediction, by indicators ADX,MACD,RSI,CCI BSE stock exchange
Daily price and charts and targets MilgreyFin Strong Daily Stock price targets for MilgreyFin 511018 are 78.37 and 86.86 | Daily Target 1 | 76.92 | | Daily Target 2 | 79.82 | | Daily Target 3 | 85.406666666667 | | Daily Target 4 | 88.31 | | Daily Target 5 | 93.9 |
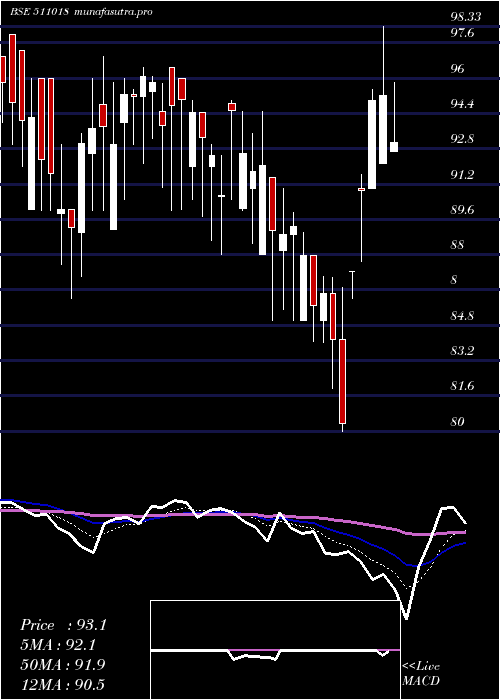
Daily price and volume Milgrey Fin
| Date |
Closing |
Open |
Range |
Volume |
Thu 23 October 2025 |
82.73 (-4.73%) |
90.00 |
82.50 - 90.99 |
1.1892 times |
Tue 21 October 2025 |
86.84 (3.01%) |
88.00 |
85.11 - 88.00 |
0.1838 times |
Mon 20 October 2025 |
84.30 (0.51%) |
87.00 |
83.87 - 87.00 |
0.4497 times |
Fri 17 October 2025 |
83.87 (-1.41%) |
89.00 |
83.00 - 89.00 |
0.5152 times |
Thu 16 October 2025 |
85.07 (0.65%) |
84.52 |
84.52 - 88.74 |
0.9265 times |
Wed 15 October 2025 |
84.52 (-0.98%) |
87.40 |
83.52 - 88.10 |
1.8524 times |
Tue 14 October 2025 |
85.36 (-4.32%) |
92.50 |
84.75 - 93.63 |
1.1614 times |
Mon 13 October 2025 |
89.21 (-0.88%) |
89.95 |
87.56 - 93.50 |
0.3894 times |
Fri 10 October 2025 |
90.00 (2.93%) |
89.70 |
89.00 - 91.80 |
1.1741 times |
Thu 09 October 2025 |
87.44 (5%) |
83.28 |
83.28 - 87.44 |
2.1583 times |
Wed 08 October 2025 |
83.28 (-1.54%) |
84.58 |
82.30 - 88.00 |
0.9416 times |
Weekly price and charts MilgreyFin Strong weekly Stock price targets for MilgreyFin 511018 are 78.37 and 86.86 | Weekly Target 1 | 76.92 | | Weekly Target 2 | 79.82 | | Weekly Target 3 | 85.406666666667 | | Weekly Target 4 | 88.31 | | Weekly Target 5 | 93.9 |
Weekly price and volumes for Milgrey Fin
| Date |
Closing |
Open |
Range |
Volume |
Thu 23 October 2025 |
82.73 (-1.36%) |
87.00 |
82.50 - 90.99 |
0.205 times |
Fri 17 October 2025 |
83.87 (-6.81%) |
89.95 |
83.00 - 93.63 |
0.5448 times |
Fri 10 October 2025 |
90.00 (-2.4%) |
87.60 |
82.30 - 91.90 |
0.9838 times |
Fri 03 October 2025 |
92.21 (-2.73%) |
91.25 |
91.25 - 103.00 |
0.7874 times |
Fri 26 September 2025 |
94.80 (-4.15%) |
102.00 |
93.40 - 103.75 |
1.6225 times |
Fri 19 September 2025 |
98.90 (-3.89%) |
97.80 |
90.70 - 104.00 |
1.3486 times |
Fri 12 September 2025 |
102.90 (-8.08%) |
111.00 |
101.55 - 116.85 |
0.7227 times |
Fri 05 September 2025 |
111.95 (-6.51%) |
119.50 |
110.45 - 120.00 |
0.7367 times |
Fri 29 August 2025 |
119.75 (-4.01%) |
127.00 |
110.95 - 127.00 |
2.2169 times |
Fri 22 August 2025 |
124.75 (-0.68%) |
126.20 |
119.35 - 136.00 |
0.8317 times |
Thu 14 August 2025 |
125.60 (-8.69%) |
141.90 |
123.55 - 141.90 |
0.6189 times |

Monthly price and charts MilgreyFin Strong monthly Stock price targets for MilgreyFin 511018 are 72.17 and 92.87 | Monthly Target 1 | 68.64 | | Monthly Target 2 | 75.69 | | Monthly Target 3 | 89.343333333333 | | Monthly Target 4 | 96.39 | | Monthly Target 5 | 110.04 |
Monthly price and volumes Milgrey Fin
| Date |
Closing |
Open |
Range |
Volume |
Thu 23 October 2025 |
82.73 (-17.19%) |
103.00 |
82.30 - 103.00 |
0.4585 times |
Tue 30 September 2025 |
99.90 (-16.58%) |
119.50 |
90.70 - 120.00 |
1.0633 times |
Fri 29 August 2025 |
119.75 (-14.56%) |
134.50 |
110.95 - 145.50 |
1.1458 times |
Thu 31 July 2025 |
140.15 (46.92%) |
98.70 |
92.21 - 142.95 |
2.2951 times |
Mon 30 June 2025 |
95.39 (3.68%) |
88.65 |
84.03 - 102.99 |
0.7976 times |
Fri 30 May 2025 |
92.00 (-1.18%) |
91.65 |
72.30 - 97.13 |
1.257 times |
Wed 30 April 2025 |
93.10 (-1.5%) |
90.10 |
80.00 - 98.33 |
0.5027 times |
Fri 28 March 2025 |
94.52 (3.09%) |
89.86 |
86.00 - 97.00 |
0.455 times |
Fri 28 February 2025 |
91.69 (-5.47%) |
98.11 |
87.54 - 104.00 |
0.7093 times |
Fri 31 January 2025 |
97.00 (-4.9%) |
104.00 |
94.40 - 116.25 |
1.3158 times |
Tue 31 December 2024 |
102.00 (34.33%) |
74.42 |
74.42 - 104.84 |
2.5944 times |

DMA SMA EMA moving averages of Milgrey Fin 511018
DMA (daily moving average) of Milgrey Fin 511018
| DMA period | DMA value | | 5 day DMA | 84.56 | | 12 day DMA | 85.6 | | 20 day DMA | 89.62 | | 35 day DMA | 96 | | 50 day DMA | 104.7 | | 100 day DMA | 108.76 | | 150 day DMA | 102.05 | | 200 day DMA | 101.59 | EMA (exponential moving average) of Milgrey Fin 511018
| EMA period | EMA current | EMA prev | EMA prev2 | | 5 day EMA | 84.65 | 85.61 | 85 | | 12 day EMA | 86.71 | 87.43 | 87.54 | | 20 day EMA | 90.01 | 90.78 | 91.19 | | 35 day EMA | 97.76 | 98.65 | 99.34 | | 50 day EMA | 105.58 | 106.51 | 107.31 |
SMA (simple moving average) of Milgrey Fin 511018
| SMA period | SMA current | SMA prev | SMA prev2 | | 5 day SMA | 84.56 | 84.92 | 84.62 | | 12 day SMA | 85.6 | 86.06 | 86.51 | | 20 day SMA | 89.62 | 90.25 | 90.91 | | 35 day SMA | 96 | 97.04 | 97.87 | | 50 day SMA | 104.7 | 105.8 | 106.84 | | 100 day SMA | 108.76 | 108.85 | 108.91 | | 150 day SMA | 102.05 | 102.12 | 102.16 | | 200 day SMA | 101.59 | 101.69 | 101.76 |
|
|
