UP 509960 full analysis,charts,indicators,moving averages,SMA,DMA,EMA,ADX,MACD,RSIU P 509960 WideScreen charts, DMA,SMA,EMA technical analysis, forecast prediction, by indicators ADX,MACD,RSI,CCI BSE stock exchange
Daily price and charts and targets UP Strong Daily Stock price targets for UP 509960 are 1804.95 and 1835.05 | Daily Target 1 | 1779.87 | | Daily Target 2 | 1799.93 | | Daily Target 3 | 1809.9666666667 | | Daily Target 4 | 1830.03 | | Daily Target 5 | 1840.07 |
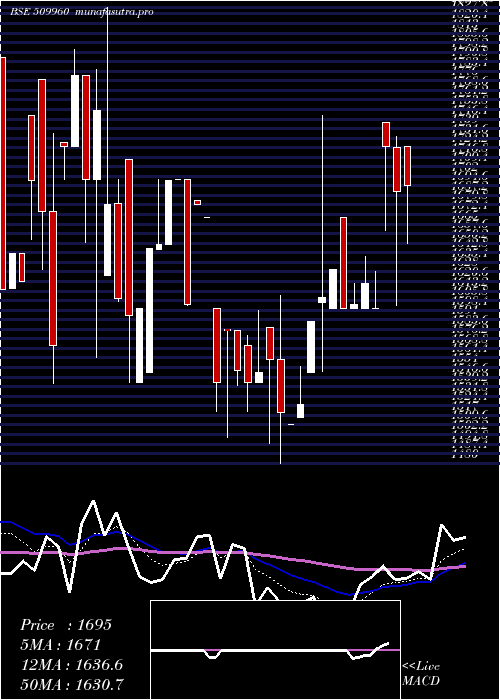
Daily price and volume U P
| Date |
Closing |
Open |
Range |
Volume |
Wed 03 September 2025 |
1820.00 (1.72%) |
1789.90 |
1789.90 - 1820.00 |
0.9261 times |
Tue 02 September 2025 |
1789.25 (4.63%) |
1651.05 |
1651.05 - 1800.00 |
1.8582 times |
Fri 29 August 2025 |
1710.00 (-3.92%) |
1939.95 |
1705.00 - 1939.95 |
0.408 times |
Thu 28 August 2025 |
1779.75 (2.88%) |
1818.00 |
1711.05 - 1818.00 |
0.4541 times |
Tue 26 August 2025 |
1730.00 (-3.74%) |
1797.15 |
1730.00 - 1797.15 |
0.0208 times |
Mon 25 August 2025 |
1797.15 (2.96%) |
1712.05 |
1712.05 - 1817.90 |
0.1578 times |
Fri 22 August 2025 |
1745.45 (0.83%) |
1750.00 |
1700.00 - 1750.05 |
1.6498 times |
Thu 21 August 2025 |
1731.05 (-1.93%) |
1751.00 |
1731.05 - 1779.95 |
1.4875 times |
Wed 20 August 2025 |
1765.15 (0.26%) |
1750.00 |
1750.00 - 1800.05 |
2.2543 times |
Tue 19 August 2025 |
1760.50 (-2.6%) |
1854.00 |
1753.15 - 1875.00 |
0.7832 times |
Mon 18 August 2025 |
1807.55 (0.42%) |
1780.05 |
1750.00 - 1825.00 |
3.4663 times |
Weekly price and charts UP Strong weekly Stock price targets for UP 509960 are 1735.53 and 1904.48 | Weekly Target 1 | 1594.73 | | Weekly Target 2 | 1707.37 | | Weekly Target 3 | 1763.6833333333 | | Weekly Target 4 | 1876.32 | | Weekly Target 5 | 1932.63 |
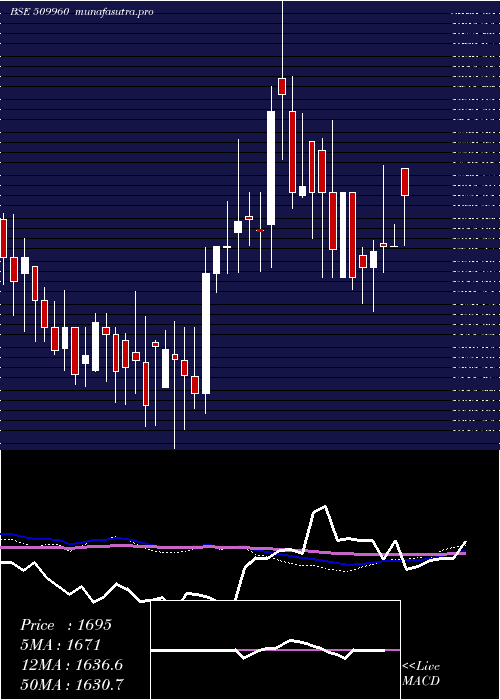
Weekly price and volumes for U P
| Date |
Closing |
Open |
Range |
Volume |
Wed 03 September 2025 |
1820.00 (6.43%) |
1651.05 |
1651.05 - 1820.00 |
0.8004 times |
Fri 29 August 2025 |
1710.00 (-2.03%) |
1712.05 |
1705.00 - 1939.95 |
0.2992 times |
Fri 22 August 2025 |
1745.45 (-3.03%) |
1780.05 |
1700.00 - 1875.00 |
2.7714 times |
Thu 14 August 2025 |
1800.00 (4.53%) |
1799.00 |
1700.20 - 1830.00 |
1.4052 times |
Fri 08 August 2025 |
1722.05 (-6.92%) |
1877.70 |
1700.00 - 1967.00 |
1.0199 times |
Fri 01 August 2025 |
1850.10 (1.29%) |
1809.00 |
1725.15 - 2000.00 |
1.5541 times |
Fri 25 July 2025 |
1826.60 (-4.01%) |
1993.95 |
1760.00 - 1993.95 |
0.6121 times |
Fri 18 July 2025 |
1903.00 (0.69%) |
1888.00 |
1800.10 - 1999.90 |
1.2108 times |
Thu 10 July 2025 |
1889.90 (6.28%) |
1780.00 |
1780.00 - 1898.00 |
0.0146 times |
Fri 04 July 2025 |
1778.25 (-8.66%) |
1988.00 |
1720.30 - 1988.00 |
0.3124 times |
Fri 27 June 2025 |
1946.90 (2.41%) |
1885.00 |
1830.00 - 1987.95 |
0.357 times |
Monthly price and charts UP Strong monthly Stock price targets for UP 509960 are 1735.53 and 1904.48 | Monthly Target 1 | 1594.73 | | Monthly Target 2 | 1707.37 | | Monthly Target 3 | 1763.6833333333 | | Monthly Target 4 | 1876.32 | | Monthly Target 5 | 1932.63 |
Monthly price and volumes U P
| Date |
Closing |
Open |
Range |
Volume |
Wed 03 September 2025 |
1820.00 (6.43%) |
1651.05 |
1651.05 - 1820.00 |
0.2855 times |
Fri 29 August 2025 |
1710.00 (-8.93%) |
2000.00 |
1700.00 - 2000.00 |
1.9861 times |
Thu 31 July 2025 |
1877.70 (1.65%) |
1910.00 |
1720.30 - 2000.00 |
1.2416 times |
Mon 30 June 2025 |
1847.30 (6.47%) |
1735.00 |
1691.50 - 1988.00 |
0.6574 times |
Fri 30 May 2025 |
1735.00 (1.55%) |
1879.25 |
1600.00 - 1879.25 |
0.7033 times |
Wed 30 April 2025 |
1708.45 (7.45%) |
1604.55 |
1551.05 - 1799.95 |
0.463 times |
Fri 28 March 2025 |
1589.95 (-0.27%) |
1542.35 |
1480.00 - 1700.00 |
0.3471 times |
Fri 28 February 2025 |
1594.25 (-6.22%) |
1695.05 |
1542.10 - 1847.00 |
0.5349 times |
Fri 31 January 2025 |
1700.00 (3.45%) |
1676.25 |
1553.00 - 2110.00 |
1.6983 times |
Tue 31 December 2024 |
1643.35 (23.8%) |
1327.35 |
1290.10 - 1798.90 |
2.0829 times |
Fri 29 November 2024 |
1327.45 (-6.1%) |
1413.70 |
1225.50 - 1460.00 |
0.3185 times |

DMA SMA EMA moving averages of U P 509960
DMA (daily moving average) of U P 509960
| DMA period | DMA value | | 5 day DMA | 1765.8 | | 12 day DMA | 1769.65 | | 20 day DMA | 1776.42 | | 35 day DMA | 1816.03 | | 50 day DMA | 1836.72 | | 100 day DMA | 1766.16 | | 150 day DMA | 1741.6 | | 200 day DMA | 1674.78 | EMA (exponential moving average) of U P 509960
| EMA period | EMA current | EMA prev | EMA prev2 | | 5 day EMA | 1780.42 | 1760.64 | 1746.34 | | 12 day EMA | 1776.14 | 1768.17 | 1764.34 | | 20 day EMA | 1786.3 | 1782.75 | 1782.07 | | 35 day EMA | 1805.99 | 1805.17 | 1806.11 | | 50 day EMA | 1832.02 | 1832.51 | 1834.28 |
SMA (simple moving average) of U P 509960
| SMA period | SMA current | SMA prev | SMA prev2 | | 5 day SMA | 1765.8 | 1761.23 | 1752.47 | | 12 day SMA | 1769.65 | 1767.99 | 1768.78 | | 20 day SMA | 1776.42 | 1777.93 | 1782.35 | | 35 day SMA | 1816.03 | 1818.03 | 1819.75 | | 50 day SMA | 1836.72 | 1839.3 | 1840.51 | | 100 day SMA | 1766.16 | 1763.46 | 1760.99 | | 150 day SMA | 1741.6 | 1739.82 | 1738.76 | | 200 day SMA | 1674.78 | 1672.58 | 1670.34 |
|
|
