ShalimarPai 509874 full analysis,charts,indicators,moving averages,SMA,DMA,EMA,ADX,MACD,RSIShalimar Pai 509874 WideScreen charts, DMA,SMA,EMA technical analysis, forecast prediction, by indicators ADX,MACD,RSI,CCI BSE stock exchange
Daily price and charts and targets ShalimarPai Strong Daily Stock price targets for ShalimarPai 509874 are 77.52 and 80.12 | Daily Target 1 | 76.85 | | Daily Target 2 | 78.19 | | Daily Target 3 | 79.45 | | Daily Target 4 | 80.79 | | Daily Target 5 | 82.05 |
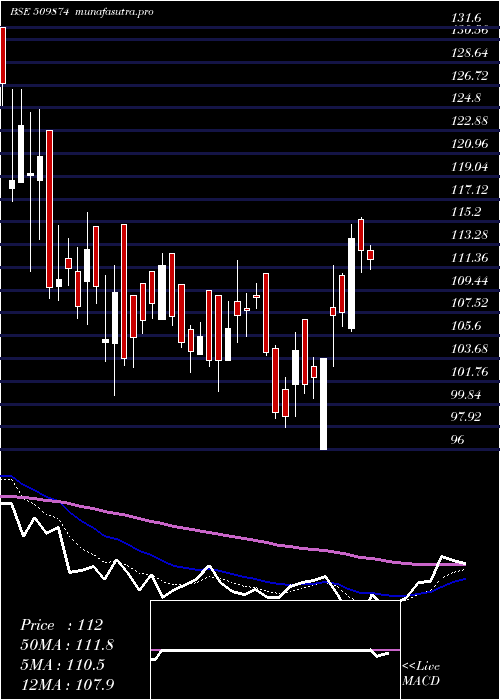
Daily price and volume Shalimar Pai
| Date |
Closing |
Open |
Range |
Volume |
Thu 23 October 2025 |
79.53 (-2.56%) |
80.71 |
78.11 - 80.71 |
0.3303 times |
Tue 21 October 2025 |
81.62 (0.74%) |
79.19 |
79.19 - 82.24 |
0.0835 times |
Mon 20 October 2025 |
81.02 (1.25%) |
80.20 |
80.13 - 82.20 |
0.9967 times |
Fri 17 October 2025 |
80.02 (0.16%) |
83.59 |
78.89 - 87.98 |
7.075 times |
Thu 16 October 2025 |
79.89 (-0.39%) |
80.30 |
79.00 - 80.56 |
0.3003 times |
Wed 15 October 2025 |
80.20 (0.87%) |
80.49 |
79.48 - 80.68 |
0.2021 times |
Tue 14 October 2025 |
79.51 (-2.5%) |
83.00 |
79.25 - 83.00 |
0.0923 times |
Mon 13 October 2025 |
81.55 (1.3%) |
81.75 |
79.71 - 81.75 |
0.3153 times |
Fri 10 October 2025 |
80.50 (-1.83%) |
82.95 |
80.50 - 82.95 |
0.2715 times |
Thu 09 October 2025 |
82.00 (-0.99%) |
81.65 |
81.65 - 83.47 |
0.3329 times |
Wed 08 October 2025 |
82.82 (0.22%) |
82.88 |
82.36 - 83.39 |
0.1799 times |
Weekly price and charts ShalimarPai Strong weekly Stock price targets for ShalimarPai 509874 are 76.76 and 80.89 | Weekly Target 1 | 75.83 | | Weekly Target 2 | 77.68 | | Weekly Target 3 | 79.96 | | Weekly Target 4 | 81.81 | | Weekly Target 5 | 84.09 |
Weekly price and volumes for Shalimar Pai
| Date |
Closing |
Open |
Range |
Volume |
Thu 23 October 2025 |
79.53 (-0.61%) |
80.20 |
78.11 - 82.24 |
0.1627 times |
Fri 17 October 2025 |
80.02 (-0.6%) |
81.75 |
78.89 - 87.98 |
0.9212 times |
Fri 10 October 2025 |
80.50 (-4.49%) |
85.12 |
80.50 - 86.83 |
0.2139 times |
Fri 03 October 2025 |
84.28 (9.63%) |
75.02 |
75.02 - 87.53 |
0.7768 times |
Fri 26 September 2025 |
76.88 (-10.25%) |
87.49 |
76.00 - 87.49 |
0.4574 times |
Fri 19 September 2025 |
85.66 (17.34%) |
71.80 |
71.80 - 88.71 |
5.9691 times |
Fri 12 September 2025 |
73.00 (0.4%) |
73.48 |
72.40 - 76.00 |
0.3517 times |
Fri 05 September 2025 |
72.71 (1.62%) |
71.77 |
71.00 - 75.66 |
0.4614 times |
Fri 29 August 2025 |
71.55 (-2.09%) |
73.12 |
71.03 - 78.00 |
0.3783 times |
Fri 22 August 2025 |
73.08 (3.79%) |
71.71 |
70.42 - 74.95 |
0.3074 times |
Thu 14 August 2025 |
70.41 (-6.36%) |
74.75 |
70.02 - 78.57 |
0.3907 times |

Monthly price and charts ShalimarPai Strong monthly Stock price targets for ShalimarPai 509874 are 73.89 and 83.76 | Monthly Target 1 | 72 | | Monthly Target 2 | 75.77 | | Monthly Target 3 | 81.873333333333 | | Monthly Target 4 | 85.64 | | Monthly Target 5 | 91.74 |
Monthly price and volumes Shalimar Pai
| Date |
Closing |
Open |
Range |
Volume |
Thu 23 October 2025 |
79.53 (-7.76%) |
86.15 |
78.11 - 87.98 |
0.4876 times |
Tue 30 September 2025 |
86.22 (20.5%) |
71.77 |
71.00 - 88.71 |
2.7063 times |
Fri 29 August 2025 |
71.55 (-12.77%) |
81.15 |
70.02 - 83.00 |
0.5199 times |
Thu 31 July 2025 |
82.02 (-15.63%) |
98.90 |
80.01 - 99.40 |
0.759 times |
Mon 30 June 2025 |
97.22 (-2.78%) |
101.59 |
94.69 - 106.95 |
0.9719 times |
Fri 30 May 2025 |
100.00 (-5.15%) |
105.00 |
91.35 - 106.80 |
0.7224 times |
Wed 30 April 2025 |
105.43 (6.71%) |
101.50 |
96.00 - 118.91 |
0.5841 times |
Fri 28 March 2025 |
98.80 (-9.52%) |
114.95 |
97.90 - 114.95 |
1.517 times |
Fri 28 February 2025 |
109.20 (-21.78%) |
138.35 |
100.55 - 141.00 |
0.6428 times |
Fri 31 January 2025 |
139.60 (10.88%) |
127.00 |
120.80 - 143.80 |
1.089 times |
Tue 31 December 2024 |
125.90 (17.39%) |
109.30 |
104.75 - 137.00 |
1.029 times |

DMA SMA EMA moving averages of Shalimar Pai 509874
DMA (daily moving average) of Shalimar Pai 509874
| DMA period | DMA value | | 5 day DMA | 80.42 | | 12 day DMA | 80.94 | | 20 day DMA | 81.37 | | 35 day DMA | 79.11 | | 50 day DMA | 77.22 | | 100 day DMA | 85.42 | | 150 day DMA | 91.87 | | 200 day DMA | 100.01 | EMA (exponential moving average) of Shalimar Pai 509874
| EMA period | EMA current | EMA prev | EMA prev2 | | 5 day EMA | 80.45 | 80.91 | 80.55 | | 12 day EMA | 80.75 | 80.97 | 80.85 | | 20 day EMA | 80.48 | 80.58 | 80.47 | | 35 day EMA | 79.18 | 79.16 | 79.01 | | 50 day EMA | 77.51 | 77.43 | 77.26 |
SMA (simple moving average) of Shalimar Pai 509874
| SMA period | SMA current | SMA prev | SMA prev2 | | 5 day SMA | 80.42 | 80.55 | 80.13 | | 12 day SMA | 80.94 | 81.2 | 81.42 | | 20 day SMA | 81.37 | 81.45 | 81.49 | | 35 day SMA | 79.11 | 78.98 | 78.69 | | 50 day SMA | 77.22 | 77.13 | 77.02 | | 100 day SMA | 85.42 | 85.63 | 85.83 | | 150 day SMA | 91.87 | 92.06 | 92.23 | | 200 day SMA | 100.01 | 100.27 | 100.5 |
|
|
