KothariInd 509732 full analysis,charts,indicators,moving averages,SMA,DMA,EMA,ADX,MACD,RSIKothari Ind 509732 WideScreen charts, DMA,SMA,EMA technical analysis, forecast prediction, by indicators ADX,MACD,RSI,CCI BSE stock exchange
Daily price and charts and targets KothariInd Strong Daily Stock price targets for KothariInd 509732 are 579.8 and 579.8 | Daily Target 1 | 579.8 | | Daily Target 2 | 579.8 | | Daily Target 3 | 579.8 | | Daily Target 4 | 579.8 | | Daily Target 5 | 579.8 |
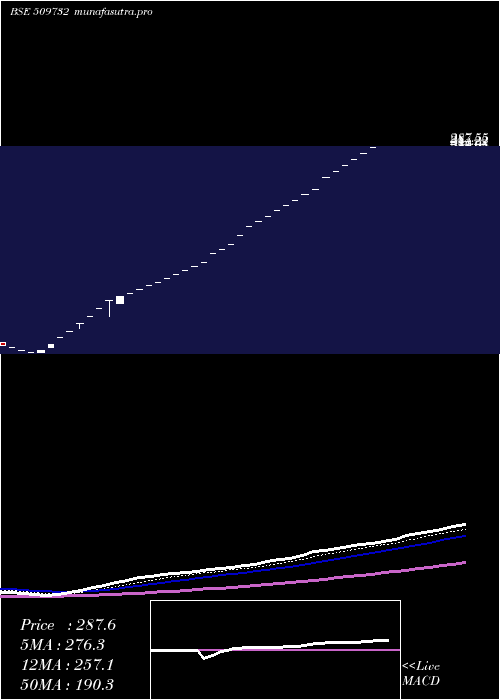
Daily price and volume Kothari Ind
| Date |
Closing |
Open |
Range |
Volume |
Wed 03 September 2025 |
579.80 (2%) |
579.80 |
579.80 - 579.80 |
0.4727 times |
Tue 02 September 2025 |
568.45 (1.99%) |
568.45 |
568.45 - 568.45 |
1.2623 times |
Mon 01 September 2025 |
557.35 (1.99%) |
557.35 |
557.35 - 557.35 |
0.4462 times |
Fri 29 August 2025 |
546.45 (2%) |
546.45 |
546.45 - 546.45 |
0.2961 times |
Thu 28 August 2025 |
535.75 (2%) |
514.75 |
514.75 - 535.75 |
2.8228 times |
Tue 26 August 2025 |
525.25 (-2%) |
525.25 |
525.25 - 525.25 |
0.7613 times |
Mon 25 August 2025 |
535.95 (-1.99%) |
535.95 |
535.95 - 535.95 |
0.5712 times |
Fri 22 August 2025 |
546.85 (-2%) |
546.85 |
546.85 - 546.85 |
0.5506 times |
Thu 21 August 2025 |
558.00 (-1.99%) |
558.00 |
558.00 - 558.00 |
2.2374 times |
Wed 20 August 2025 |
569.35 (5%) |
569.35 |
569.35 - 569.35 |
0.5794 times |
Tue 19 August 2025 |
542.25 (5%) |
542.25 |
542.25 - 542.25 |
0.7465 times |
Weekly price and charts KothariInd Strong weekly Stock price targets for KothariInd 509732 are 568.58 and 591.03 | Weekly Target 1 | 549.87 | | Weekly Target 2 | 564.83 | | Weekly Target 3 | 572.31666666667 | | Weekly Target 4 | 587.28 | | Weekly Target 5 | 594.77 |
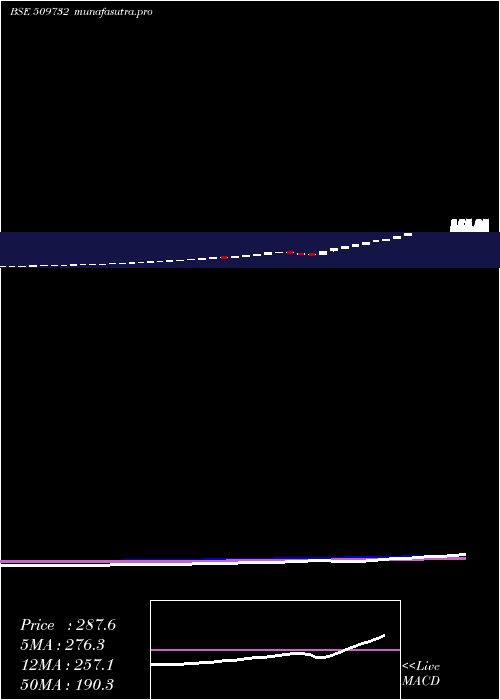
Weekly price and volumes for Kothari Ind
| Date |
Closing |
Open |
Range |
Volume |
Wed 03 September 2025 |
579.80 (6.1%) |
557.35 |
557.35 - 579.80 |
0.278 times |
Fri 29 August 2025 |
546.45 (-0.07%) |
535.95 |
514.75 - 546.45 |
0.5673 times |
Fri 22 August 2025 |
546.85 (11.17%) |
508.40 |
501.75 - 569.35 |
0.6959 times |
Thu 14 August 2025 |
491.90 (4.92%) |
469.00 |
445.45 - 500.00 |
1.3516 times |
Fri 08 August 2025 |
468.85 (5.75%) |
452.20 |
443.00 - 470.40 |
1.8062 times |
Fri 01 August 2025 |
443.35 (10.37%) |
409.70 |
409.70 - 443.35 |
0.3869 times |
Fri 25 July 2025 |
401.70 (-9.58%) |
435.40 |
401.70 - 435.40 |
1.4021 times |
Fri 18 July 2025 |
444.25 (-9.59%) |
481.55 |
444.25 - 481.55 |
0.3277 times |
Fri 11 July 2025 |
491.35 (6.07%) |
472.50 |
472.50 - 501.35 |
1.0084 times |
Fri 04 July 2025 |
463.25 (16.97%) |
415.85 |
380.10 - 463.25 |
2.1759 times |
Fri 27 June 2025 |
396.05 (25.04%) |
295.00 |
294.95 - 396.05 |
4.1915 times |
Monthly price and charts KothariInd Strong monthly Stock price targets for KothariInd 509732 are 568.58 and 591.03 | Monthly Target 1 | 549.87 | | Monthly Target 2 | 564.83 | | Monthly Target 3 | 572.31666666667 | | Monthly Target 4 | 587.28 | | Monthly Target 5 | 594.77 |
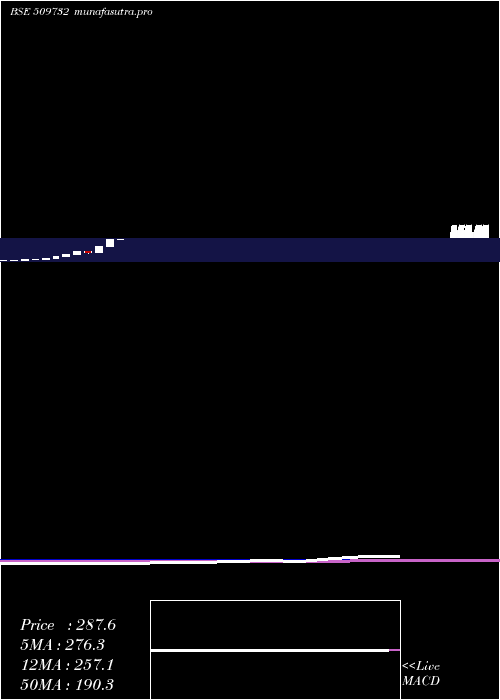
Monthly price and volumes Kothari Ind
| Date |
Closing |
Open |
Range |
Volume |
Wed 03 September 2025 |
579.80 (6.1%) |
557.35 |
557.35 - 579.80 |
0.056 times |
Fri 29 August 2025 |
546.45 (25.71%) |
443.35 |
443.00 - 569.35 |
0.899 times |
Thu 31 July 2025 |
434.70 (4.53%) |
414.00 |
400.00 - 501.35 |
0.7988 times |
Mon 30 June 2025 |
415.85 (-0.94%) |
411.45 |
294.95 - 415.85 |
1.5525 times |
Fri 30 May 2025 |
419.80 (48.89%) |
287.55 |
287.55 - 426.70 |
1.1073 times |
Wed 30 April 2025 |
281.95 (45.45%) |
197.70 |
197.70 - 281.95 |
0.3651 times |
Fri 28 March 2025 |
193.85 (77.93%) |
111.70 |
111.70 - 193.85 |
0.7089 times |
Fri 28 February 2025 |
108.95 (-13.39%) |
128.00 |
106.85 - 128.00 |
0.9005 times |
Fri 31 January 2025 |
125.79 (45.42%) |
84.77 |
83.08 - 125.79 |
1.6732 times |
Tue 31 December 2024 |
86.50 (45.4%) |
60.67 |
60.67 - 88.26 |
1.9387 times |
Fri 29 November 2024 |
59.49 (42.53%) |
42.57 |
42.57 - 59.49 |
0.0334 times |
DMA SMA EMA moving averages of Kothari Ind 509732
DMA (daily moving average) of Kothari Ind 509732
| DMA period | DMA value | | 5 day DMA | 557.56 | | 12 day DMA | 548.49 | | 20 day DMA | 516.96 | | 35 day DMA | 481.34 | | 50 day DMA | 469.14 | | 100 day DMA | 396.93 | | 150 day DMA | 309.9 | | 200 day DMA | 250.04 | EMA (exponential moving average) of Kothari Ind 509732
| EMA period | EMA current | EMA prev | EMA prev2 | | 5 day EMA | 561.82 | 552.83 | 545.02 | | 12 day EMA | 542.02 | 535.15 | 529.1 | | 20 day EMA | 521.84 | 515.74 | 510.19 | | 35 day EMA | 494.65 | 489.64 | 485 | | 50 day EMA | 466.41 | 461.78 | 457.43 |
SMA (simple moving average) of Kothari Ind 509732
| SMA period | SMA current | SMA prev | SMA prev2 | | 5 day SMA | 557.56 | 546.65 | 540.15 | | 12 day SMA | 548.49 | 541.17 | 534.09 | | 20 day SMA | 516.96 | 510.58 | 504.32 | | 35 day SMA | 481.34 | 478.54 | 476.33 | | 50 day SMA | 469.14 | 464.07 | 459.03 | | 100 day SMA | 396.93 | 393.15 | 389.44 | | 150 day SMA | 309.9 | 306.71 | 303.58 | | 200 day SMA | 250.04 | 247.36 | 244.72 |
|
|
