TvsSrichakr 509243 full analysis,charts,indicators,moving averages,SMA,DMA,EMA,ADX,MACD,RSITvs Srichakr 509243 WideScreen charts, DMA,SMA,EMA technical analysis, forecast prediction, by indicators ADX,MACD,RSI,CCI BSE stock exchange
Daily price and charts and targets TvsSrichakr Strong Daily Stock price targets for TvsSrichakr 509243 are 4001.78 and 4156.28 | Daily Target 1 | 3974.75 | | Daily Target 2 | 4028.8 | | Daily Target 3 | 4129.25 | | Daily Target 4 | 4183.3 | | Daily Target 5 | 4283.75 |
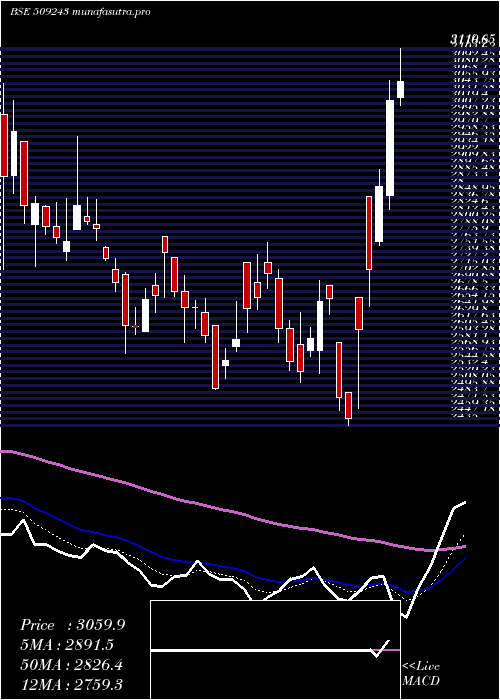
Daily price and volume Tvs Srichakr
| Date |
Closing |
Open |
Range |
Volume |
Thu 23 October 2025 |
4082.85 (-2.51%) |
4213.90 |
4075.20 - 4229.70 |
0.8612 times |
Tue 21 October 2025 |
4187.80 (1.92%) |
4166.00 |
4136.05 - 4197.90 |
0.2511 times |
Mon 20 October 2025 |
4109.05 (2.9%) |
4029.50 |
4029.15 - 4200.00 |
3.0361 times |
Fri 17 October 2025 |
3993.10 (2.13%) |
3701.60 |
3701.60 - 4044.00 |
1.671 times |
Thu 16 October 2025 |
3910.00 (3.12%) |
3840.00 |
3840.00 - 3975.00 |
1.5712 times |
Wed 15 October 2025 |
3791.80 (-0.25%) |
3799.60 |
3781.40 - 3822.50 |
0.3348 times |
Tue 14 October 2025 |
3801.35 (-0.58%) |
3812.25 |
3801.00 - 3857.40 |
0.1867 times |
Mon 13 October 2025 |
3823.45 (0.35%) |
3800.00 |
3797.70 - 3895.00 |
0.5763 times |
Fri 10 October 2025 |
3810.20 (-0.97%) |
3846.00 |
3798.00 - 3862.70 |
0.5795 times |
Thu 09 October 2025 |
3847.60 (-1.1%) |
3929.95 |
3840.85 - 3929.95 |
0.9321 times |
Wed 08 October 2025 |
3890.35 (1.62%) |
3888.80 |
3843.35 - 3965.60 |
2.4581 times |
Weekly price and charts TvsSrichakr Strong weekly Stock price targets for TvsSrichakr 509243 are 4056 and 4256.55 | Weekly Target 1 | 3913.35 | | Weekly Target 2 | 3998.1 | | Weekly Target 3 | 4113.9 | | Weekly Target 4 | 4198.65 | | Weekly Target 5 | 4314.45 |
Weekly price and volumes for Tvs Srichakr
| Date |
Closing |
Open |
Range |
Volume |
Thu 23 October 2025 |
4082.85 (2.25%) |
4029.50 |
4029.15 - 4229.70 |
0.7307 times |
Fri 17 October 2025 |
3993.10 (4.8%) |
3800.00 |
3701.60 - 4044.00 |
0.7645 times |
Fri 10 October 2025 |
3810.20 (2.81%) |
3604.05 |
3604.05 - 3965.60 |
1.999 times |
Fri 03 October 2025 |
3706.20 (12.05%) |
3310.00 |
3013.05 - 3800.00 |
2.7521 times |
Fri 26 September 2025 |
3307.70 (3.33%) |
3150.05 |
3150.05 - 3392.85 |
1.3282 times |
Fri 19 September 2025 |
3201.15 (10.11%) |
2815.05 |
2815.05 - 3223.00 |
0.7693 times |
Fri 12 September 2025 |
2907.20 (-0.18%) |
2927.00 |
2868.00 - 3025.65 |
0.2646 times |
Fri 05 September 2025 |
2912.45 (2.56%) |
2869.00 |
2835.95 - 2975.80 |
0.4701 times |
Fri 29 August 2025 |
2839.85 (-1.95%) |
2890.40 |
2785.95 - 2903.70 |
0.3992 times |
Fri 22 August 2025 |
2896.45 (2.06%) |
2840.00 |
2840.00 - 2990.30 |
0.5223 times |
Thu 14 August 2025 |
2838.05 (0.95%) |
2811.00 |
2774.30 - 2995.00 |
2.432 times |

Monthly price and charts TvsSrichakr Strong monthly Stock price targets for TvsSrichakr 509243 are 3547.95 and 4764.6 | Monthly Target 1 | 2558.55 | | Monthly Target 2 | 3320.7 | | Monthly Target 3 | 3775.2 | | Monthly Target 4 | 4537.35 | | Monthly Target 5 | 4991.85 |
Monthly price and volumes Tvs Srichakr
| Date |
Closing |
Open |
Range |
Volume |
Thu 23 October 2025 |
4082.85 (27.55%) |
3013.05 |
3013.05 - 4229.70 |
1.5814 times |
Tue 30 September 2025 |
3200.90 (12.71%) |
2869.00 |
2815.05 - 3392.85 |
0.8246 times |
Fri 29 August 2025 |
2839.85 (-5.96%) |
3032.00 |
2761.05 - 3032.00 |
0.9811 times |
Thu 31 July 2025 |
3019.70 (-0.11%) |
3023.00 |
2959.75 - 3410.15 |
1.8431 times |
Mon 30 June 2025 |
3023.00 (3.24%) |
2990.00 |
2881.95 - 3281.55 |
1.2743 times |
Fri 30 May 2025 |
2928.05 (1.76%) |
2887.10 |
2775.00 - 3146.25 |
0.6633 times |
Wed 30 April 2025 |
2877.45 (13.62%) |
2572.05 |
2435.00 - 3150.00 |
1.0409 times |
Fri 28 March 2025 |
2532.60 (-6.04%) |
2709.00 |
2500.00 - 2778.60 |
0.8749 times |
Fri 28 February 2025 |
2695.45 (-13.7%) |
3011.05 |
2678.00 - 3479.95 |
0.6051 times |
Fri 31 January 2025 |
3123.35 (-10.74%) |
3510.25 |
2955.15 - 3621.75 |
0.3113 times |
Tue 31 December 2024 |
3499.00 (-6.88%) |
3612.00 |
3468.90 - 3947.85 |
0.2772 times |

DMA SMA EMA moving averages of Tvs Srichakr 509243
DMA (daily moving average) of Tvs Srichakr 509243
| DMA period | DMA value | | 5 day DMA | 4056.56 | | 12 day DMA | 3923 | | 20 day DMA | 3731.9 | | 35 day DMA | 3428.14 | | 50 day DMA | 3261.08 | | 100 day DMA | 3157.94 | | 150 day DMA | 3041.17 | | 200 day DMA | 3053.78 | EMA (exponential moving average) of Tvs Srichakr 509243
| EMA period | EMA current | EMA prev | EMA prev2 | | 5 day EMA | 4052.24 | 4036.93 | 3961.5 | | 12 day EMA | 3907.08 | 3875.13 | 3818.3 | | 20 day EMA | 3755.86 | 3721.45 | 3672.38 | | 35 day EMA | 3535.13 | 3502.88 | 3462.56 | | 50 day EMA | 3309.18 | 3277.61 | 3240.47 |
SMA (simple moving average) of Tvs Srichakr 509243
| SMA period | SMA current | SMA prev | SMA prev2 | | 5 day SMA | 4056.56 | 3998.35 | 3921.06 | | 12 day SMA | 3923 | 3896.99 | 3856.85 | | 20 day SMA | 3731.9 | 3694.29 | 3648.51 | | 35 day SMA | 3428.14 | 3393.98 | 3355.93 | | 50 day SMA | 3261.08 | 3235.65 | 3208.4 | | 100 day SMA | 3157.94 | 3146.42 | 3133.79 | | 150 day SMA | 3041.17 | 3031.75 | 3021.59 | | 200 day SMA | 3053.78 | 3050.83 | 3047.65 |
|
|
