VisakaInd 509055 full analysis,charts,indicators,moving averages,SMA,DMA,EMA,ADX,MACD,RSIVisaka Ind 509055 WideScreen charts, DMA,SMA,EMA technical analysis, forecast prediction, by indicators ADX,MACD,RSI,CCI BSE stock exchange
Daily price and charts and targets VisakaInd Strong Daily Stock price targets for VisakaInd 509055 are 61.29 and 63.51 | Daily Target 1 | 60.84 | | Daily Target 2 | 61.73 | | Daily Target 3 | 63.056666666667 | | Daily Target 4 | 63.95 | | Daily Target 5 | 65.28 |
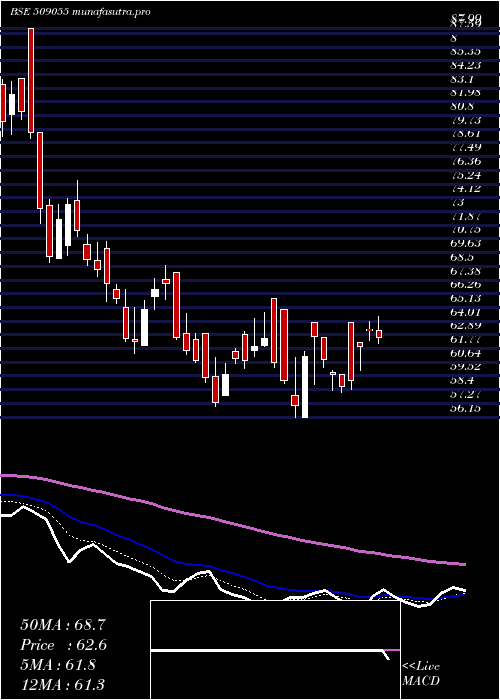
Daily price and volume Visaka Ind
| Date |
Closing |
Open |
Range |
Volume |
Thu 17 April 2025 |
62.63 (-1%) |
63.26 |
62.16 - 64.38 |
0.8237 times |
Wed 16 April 2025 |
63.26 (2.2%) |
63.29 |
62.45 - 63.95 |
0.5827 times |
Tue 15 April 2025 |
61.90 (4.63%) |
62.30 |
59.94 - 62.30 |
0.3275 times |
Fri 11 April 2025 |
59.16 (0.89%) |
63.90 |
58.39 - 63.90 |
0.6721 times |
Wed 09 April 2025 |
58.64 (-1.61%) |
59.66 |
58.14 - 59.67 |
0.0807 times |
Tue 08 April 2025 |
59.60 (-2.1%) |
59.84 |
58.36 - 59.96 |
0.5978 times |
Fri 04 April 2025 |
60.88 (-2.96%) |
62.64 |
60.22 - 62.64 |
0.645 times |
Wed 02 April 2025 |
62.74 (2.67%) |
63.90 |
58.80 - 63.90 |
0.6722 times |
Tue 01 April 2025 |
61.11 (7%) |
56.15 |
56.15 - 61.49 |
1.7019 times |
Fri 28 March 2025 |
57.11 (-3.42%) |
57.92 |
56.15 - 60.99 |
3.8963 times |
Wed 26 March 2025 |
59.13 (-2.43%) |
64.94 |
58.89 - 64.94 |
18.8807 times |
Weekly price and charts VisakaInd Strong weekly Stock price targets for VisakaInd 509055 are 61.29 and 65.73 | Weekly Target 1 | 57.88 | | Weekly Target 2 | 60.25 | | Weekly Target 3 | 62.316666666667 | | Weekly Target 4 | 64.69 | | Weekly Target 5 | 66.76 |
Weekly price and volumes for Visaka Ind
| Date |
Closing |
Open |
Range |
Volume |
Thu 17 April 2025 |
62.63 (5.87%) |
62.30 |
59.94 - 64.38 |
0.192 times |
Fri 11 April 2025 |
59.16 (-2.83%) |
59.84 |
58.14 - 63.90 |
0.1495 times |
Fri 04 April 2025 |
60.88 (6.6%) |
56.15 |
56.15 - 63.90 |
0.3343 times |
Fri 28 March 2025 |
57.11 (-7.75%) |
61.99 |
56.15 - 65.89 |
3.0072 times |
Fri 21 March 2025 |
61.91 (4.26%) |
59.49 |
57.00 - 64.20 |
1.3605 times |
Thu 13 March 2025 |
59.38 (-11.54%) |
68.00 |
59.00 - 68.00 |
0.8682 times |
Fri 07 March 2025 |
67.13 (1.97%) |
65.10 |
61.35 - 68.61 |
2.1092 times |
Fri 28 February 2025 |
65.83 (-7.87%) |
70.25 |
65.42 - 71.09 |
1.0369 times |
Fri 21 February 2025 |
71.45 (-10.05%) |
79.43 |
68.80 - 79.43 |
0.4905 times |
Fri 14 February 2025 |
79.43 (-8%) |
86.00 |
79.00 - 87.99 |
0.4517 times |
Fri 07 February 2025 |
86.34 (-2.67%) |
83.00 |
81.33 - 93.00 |
0.5558 times |

Monthly price and charts VisakaInd Strong monthly Stock price targets for VisakaInd 509055 are 59.39 and 67.62 | Monthly Target 1 | 52.82 | | Monthly Target 2 | 57.73 | | Monthly Target 3 | 61.053333333333 | | Monthly Target 4 | 65.96 | | Monthly Target 5 | 69.28 |
Monthly price and volumes Visaka Ind
| Date |
Closing |
Open |
Range |
Volume |
Thu 17 April 2025 |
62.63 (9.67%) |
56.15 |
56.15 - 64.38 |
0.2047 times |
Fri 28 March 2025 |
57.11 (-13.25%) |
65.10 |
56.15 - 68.61 |
2.2245 times |
Fri 28 February 2025 |
65.83 (-25.79%) |
83.00 |
65.42 - 93.00 |
0.7677 times |
Fri 31 January 2025 |
88.71 (0.08%) |
89.41 |
75.00 - 107.00 |
1.2401 times |
Tue 31 December 2024 |
88.64 (-5.2%) |
98.80 |
86.62 - 100.00 |
0.5922 times |
Fri 29 November 2024 |
93.50 (-8.38%) |
102.00 |
89.15 - 106.00 |
0.6806 times |
Thu 31 October 2024 |
102.05 (-1.16%) |
103.25 |
94.70 - 111.45 |
0.6417 times |
Mon 30 September 2024 |
103.25 (-7.94%) |
111.70 |
102.50 - 113.80 |
0.7613 times |
Fri 30 August 2024 |
112.15 (-2.73%) |
116.05 |
104.00 - 123.20 |
1.7515 times |
Wed 31 July 2024 |
115.30 (-0.6%) |
115.90 |
102.10 - 121.50 |
1.1358 times |
Fri 28 June 2024 |
116.00 (15.94%) |
102.30 |
94.75 - 123.75 |
1.5702 times |

DMA SMA EMA moving averages of Visaka Ind 509055
DMA (daily moving average) of Visaka Ind 509055
| DMA period | DMA value | | 5 day DMA | 61.12 | | 12 day DMA | 60.56 | | 20 day DMA | 60.51 | | 35 day DMA | 63.29 | | 50 day DMA | 69.26 | | 100 day DMA | 80.73 | | 150 day DMA | 88.65 | | 200 day DMA | 94.8 | EMA (exponential moving average) of Visaka Ind 509055
| EMA period | EMA current | EMA prev | EMA prev2 | | 5 day EMA | 61.77 | 61.34 | 60.38 | | 12 day EMA | 61.27 | 61.02 | 60.61 | | 20 day EMA | 62.06 | 62 | 61.87 | | 35 day EMA | 65.85 | 66.04 | 66.2 | | 50 day EMA | 69.98 | 70.28 | 70.57 |
SMA (simple moving average) of Visaka Ind 509055
| SMA period | SMA current | SMA prev | SMA prev2 | | 5 day SMA | 61.12 | 60.51 | 60.04 | | 12 day SMA | 60.56 | 60.56 | 60.45 | | 20 day SMA | 60.51 | 60.45 | 60.43 | | 35 day SMA | 63.29 | 63.59 | 64.05 | | 50 day SMA | 69.26 | 69.66 | 70.13 | | 100 day SMA | 80.73 | 81.01 | 81.35 | | 150 day SMA | 88.65 | 88.97 | 89.3 | | 200 day SMA | 94.8 | 95.07 | 95.34 |
|
|
