PanasonCar 508941 full analysis,charts,indicators,moving averages,SMA,DMA,EMA,ADX,MACD,RSIPanason Car 508941 WideScreen charts, DMA,SMA,EMA technical analysis, forecast prediction, by indicators ADX,MACD,RSI,CCI BSE stock exchange
Daily price and charts and targets PanasonCar Strong Daily Stock price targets for PanasonCar 508941 are 488.98 and 496.63 | Daily Target 1 | 483 | | Daily Target 2 | 487.3 | | Daily Target 3 | 490.65 | | Daily Target 4 | 494.95 | | Daily Target 5 | 498.3 |
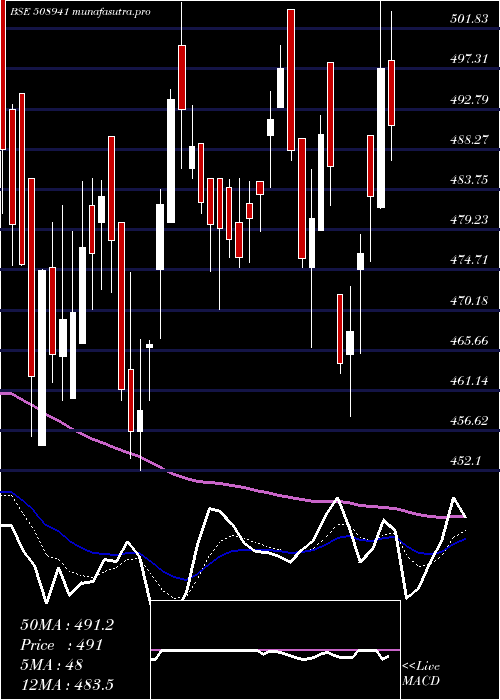
Daily price and volume Panason Car
| Date |
Closing |
Open |
Range |
Volume |
Thu 23 October 2025 |
491.60 (1.3%) |
487.50 |
486.35 - 494.00 |
1.2586 times |
Tue 21 October 2025 |
485.30 (0.09%) |
485.50 |
480.05 - 487.50 |
0.4981 times |
Mon 20 October 2025 |
484.85 (1.46%) |
479.00 |
476.20 - 486.95 |
0.3574 times |
Fri 17 October 2025 |
477.85 (-0.64%) |
480.95 |
475.30 - 480.95 |
0.9122 times |
Thu 16 October 2025 |
480.95 (-0.38%) |
482.80 |
475.00 - 482.90 |
1.1836 times |
Wed 15 October 2025 |
482.80 (0.49%) |
482.00 |
478.40 - 485.45 |
0.5612 times |
Tue 14 October 2025 |
480.45 (-1.41%) |
487.30 |
475.95 - 491.80 |
2.9328 times |
Mon 13 October 2025 |
487.30 (0.23%) |
486.20 |
486.20 - 491.50 |
0.9047 times |
Fri 10 October 2025 |
486.20 (-0.71%) |
489.70 |
486.00 - 494.85 |
0.8759 times |
Thu 09 October 2025 |
489.70 (0.02%) |
492.95 |
488.25 - 493.70 |
0.5155 times |
Wed 08 October 2025 |
489.60 (-0.11%) |
490.00 |
489.05 - 495.00 |
1.2676 times |
Weekly price and charts PanasonCar Strong weekly Stock price targets for PanasonCar 508941 are 483.9 and 501.7 | Weekly Target 1 | 469.47 | | Weekly Target 2 | 480.53 | | Weekly Target 3 | 487.26666666667 | | Weekly Target 4 | 498.33 | | Weekly Target 5 | 505.07 |
Weekly price and volumes for Panason Car
| Date |
Closing |
Open |
Range |
Volume |
Thu 23 October 2025 |
491.60 (2.88%) |
479.00 |
476.20 - 494.00 |
0.4674 times |
Fri 17 October 2025 |
477.85 (-1.72%) |
486.20 |
475.00 - 491.80 |
1.4359 times |
Fri 10 October 2025 |
486.20 (-1.01%) |
485.35 |
485.35 - 496.50 |
0.8795 times |
Fri 03 October 2025 |
491.15 (0.1%) |
486.30 |
482.10 - 497.95 |
0.5479 times |
Fri 26 September 2025 |
490.65 (-2.56%) |
503.65 |
488.20 - 506.90 |
1.8113 times |
Fri 19 September 2025 |
503.55 (3.53%) |
488.00 |
488.00 - 512.00 |
1.7071 times |
Fri 12 September 2025 |
486.40 (-1%) |
491.30 |
485.00 - 496.45 |
0.9795 times |
Fri 05 September 2025 |
491.30 (-0.01%) |
496.25 |
483.00 - 498.50 |
0.9149 times |
Fri 29 August 2025 |
491.35 (-1.5%) |
506.90 |
481.30 - 506.95 |
0.4648 times |
Fri 22 August 2025 |
498.85 (-0.08%) |
509.95 |
495.00 - 514.90 |
0.7918 times |
Thu 14 August 2025 |
499.25 (5.08%) |
479.00 |
475.35 - 524.00 |
1.7485 times |

Monthly price and charts PanasonCar Strong monthly Stock price targets for PanasonCar 508941 are 483.3 and 504.8 | Monthly Target 1 | 466.2 | | Monthly Target 2 | 478.9 | | Monthly Target 3 | 487.7 | | Monthly Target 4 | 500.4 | | Monthly Target 5 | 509.2 |
Monthly price and volumes Panason Car
| Date |
Closing |
Open |
Range |
Volume |
Thu 23 October 2025 |
491.60 (1.36%) |
485.55 |
475.00 - 496.50 |
0.4846 times |
Tue 30 September 2025 |
485.00 (-1.29%) |
496.25 |
482.10 - 512.00 |
0.9102 times |
Fri 29 August 2025 |
491.35 (-4.58%) |
514.00 |
474.30 - 524.00 |
0.7947 times |
Thu 31 July 2025 |
514.95 (-2.37%) |
529.00 |
502.35 - 540.00 |
0.668 times |
Mon 30 June 2025 |
527.45 (1.11%) |
533.00 |
520.35 - 596.00 |
2.0485 times |
Fri 30 May 2025 |
521.65 (8.65%) |
480.75 |
451.10 - 530.00 |
1.5677 times |
Wed 30 April 2025 |
480.10 (0.85%) |
475.00 |
458.25 - 509.00 |
0.6975 times |
Fri 28 March 2025 |
476.05 (3.22%) |
463.50 |
452.10 - 504.75 |
1.0997 times |
Fri 28 February 2025 |
461.20 (-7.4%) |
480.20 |
455.00 - 524.60 |
0.9383 times |
Fri 31 January 2025 |
498.05 (-9.48%) |
559.90 |
471.70 - 577.10 |
0.7909 times |
Tue 31 December 2024 |
550.20 (-7.47%) |
592.40 |
545.30 - 650.00 |
1.3829 times |

DMA SMA EMA moving averages of Panason Car 508941
DMA (daily moving average) of Panason Car 508941
| DMA period | DMA value | | 5 day DMA | 484.11 | | 12 day DMA | 485.56 | | 20 day DMA | 487.52 | | 35 day DMA | 491.09 | | 50 day DMA | 492.26 | | 100 day DMA | 511.2 | | 150 day DMA | 503.9 | | 200 day DMA | 503.36 | EMA (exponential moving average) of Panason Car 508941
| EMA period | EMA current | EMA prev | EMA prev2 | | 5 day EMA | 486.23 | 483.54 | 482.66 | | 12 day EMA | 486.18 | 485.2 | 485.18 | | 20 day EMA | 487.6 | 487.18 | 487.38 | | 35 day EMA | 489.01 | 488.86 | 489.07 | | 50 day EMA | 490.96 | 490.93 | 491.16 |
SMA (simple moving average) of Panason Car 508941
| SMA period | SMA current | SMA prev | SMA prev2 | | 5 day SMA | 484.11 | 482.35 | 481.38 | | 12 day SMA | 485.56 | 485.31 | 485.8 | | 20 day SMA | 487.52 | 487.99 | 488.9 | | 35 day SMA | 491.09 | 491.13 | 491.16 | | 50 day SMA | 492.26 | 491.93 | 491.83 | | 100 day SMA | 511.2 | 511.52 | 511.84 | | 150 day SMA | 503.9 | 503.84 | 503.71 | | 200 day SMA | 503.36 | 503.73 | 504.15 |
|
|
