Eastbuild 507917 full analysis,charts,indicators,moving averages,SMA,DMA,EMA,ADX,MACD,RSIEastbuild 507917 WideScreen charts, DMA,SMA,EMA technical analysis, forecast prediction, by indicators ADX,MACD,RSI,CCI BSE stock exchange
Daily price and charts and targets Eastbuild Strong Daily Stock price targets for Eastbuild 507917 are 56.46 and 58.73 | Daily Target 1 | 54.63 | | Daily Target 2 | 56.02 | | Daily Target 3 | 56.896666666667 | | Daily Target 4 | 58.29 | | Daily Target 5 | 59.17 |
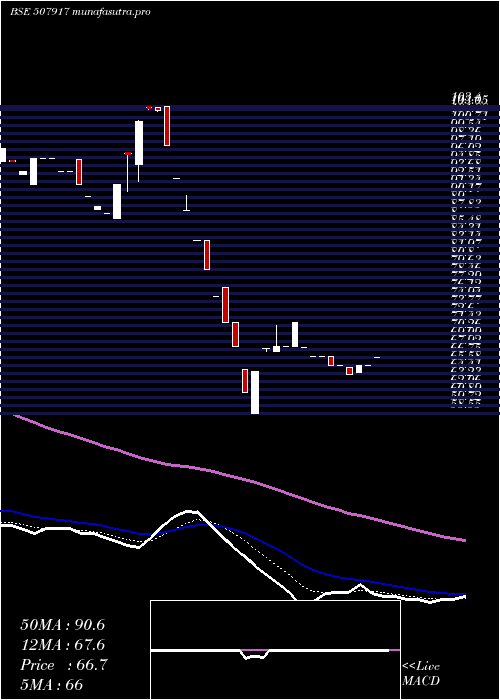
Daily price and volume Eastbuild
| Date |
Closing |
Open |
Range |
Volume |
Mon 20 October 2025 |
57.42 (4.36%) |
55.50 |
55.50 - 57.77 |
0.8415 times |
Fri 17 October 2025 |
55.02 (2.65%) |
53.60 |
52.55 - 56.28 |
1.8259 times |
Thu 16 October 2025 |
53.60 (1.48%) |
53.88 |
53.60 - 53.88 |
0.5654 times |
Wed 15 October 2025 |
52.82 (4.99%) |
50.31 |
50.31 - 52.82 |
2.5486 times |
Tue 14 October 2025 |
50.31 (0%) |
50.31 |
50.31 - 52.82 |
1.8739 times |
Mon 13 October 2025 |
50.31 (-4.75%) |
53.00 |
50.20 - 55.46 |
0.6879 times |
Thu 09 October 2025 |
52.82 (-5%) |
53.25 |
52.82 - 53.25 |
1.5786 times |
Wed 08 October 2025 |
55.60 (0%) |
55.60 |
55.60 - 55.60 |
0.0252 times |
Tue 07 October 2025 |
55.60 (4.98%) |
51.63 |
51.63 - 55.60 |
0.006 times |
Mon 06 October 2025 |
52.96 (0%) |
53.00 |
52.96 - 53.00 |
0.0468 times |
Fri 03 October 2025 |
52.96 (-4.99%) |
55.74 |
52.96 - 55.74 |
0.0768 times |
Weekly price and charts Eastbuild Strong weekly Stock price targets for Eastbuild 507917 are 56.46 and 58.73 | Weekly Target 1 | 54.63 | | Weekly Target 2 | 56.02 | | Weekly Target 3 | 56.896666666667 | | Weekly Target 4 | 58.29 | | Weekly Target 5 | 59.17 |
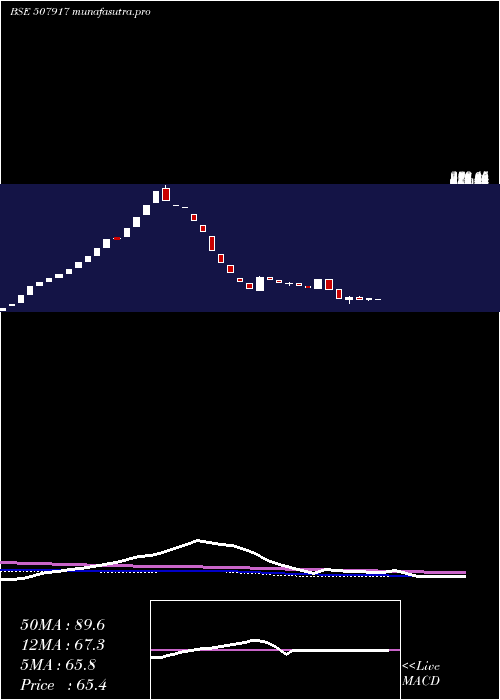
Weekly price and volumes for Eastbuild
| Date |
Closing |
Open |
Range |
Volume |
Mon 20 October 2025 |
57.42 (4.36%) |
55.50 |
55.50 - 57.77 |
0.3259 times |
Fri 17 October 2025 |
55.02 (4.17%) |
53.00 |
50.20 - 56.28 |
2.9054 times |
Thu 09 October 2025 |
52.82 (-0.26%) |
53.00 |
51.63 - 55.60 |
0.6416 times |
Fri 03 October 2025 |
52.96 (-9.73%) |
58.67 |
52.96 - 61.60 |
0.1227 times |
Fri 26 September 2025 |
58.67 (-0.07%) |
55.78 |
55.78 - 64.81 |
0.8336 times |
Fri 19 September 2025 |
58.71 (-9.77%) |
68.31 |
58.71 - 68.31 |
1.0973 times |
Fri 12 September 2025 |
65.07 (1.67%) |
60.80 |
60.80 - 68.00 |
0.5091 times |
Fri 05 September 2025 |
64.00 (0.79%) |
63.00 |
56.22 - 65.99 |
1.5748 times |
Fri 29 August 2025 |
63.50 (21.04%) |
52.47 |
52.47 - 63.50 |
1.3325 times |
Fri 22 August 2025 |
52.46 (-4.62%) |
55.27 |
49.64 - 55.27 |
0.657 times |
Thu 14 August 2025 |
55.00 (-5.24%) |
58.05 |
55.00 - 58.05 |
0.2706 times |
Monthly price and charts Eastbuild Strong monthly Stock price targets for Eastbuild 507917 are 53.81 and 61.38 | Monthly Target 1 | 47.56 | | Monthly Target 2 | 52.49 | | Monthly Target 3 | 55.13 | | Monthly Target 4 | 60.06 | | Monthly Target 5 | 62.7 |
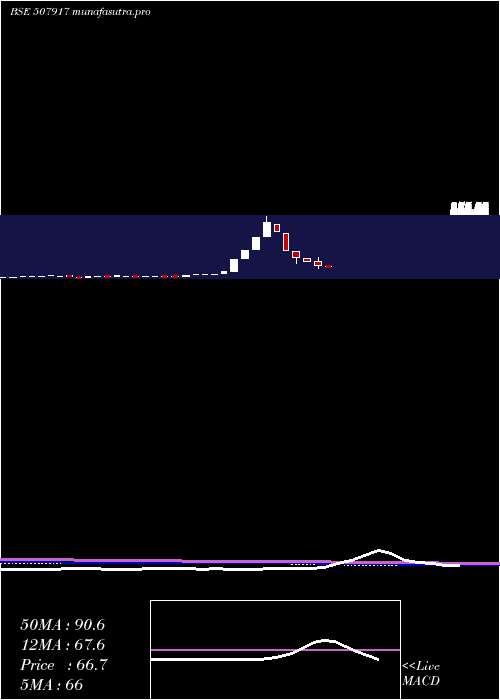
Monthly price and volumes Eastbuild
| Date |
Closing |
Open |
Range |
Volume |
Mon 20 October 2025 |
57.42 (-2.13%) |
55.74 |
50.20 - 57.77 |
1.6762 times |
Tue 30 September 2025 |
58.67 (-7.61%) |
63.00 |
55.78 - 68.31 |
1.7246 times |
Fri 29 August 2025 |
63.50 (5.1%) |
60.42 |
49.64 - 63.50 |
0.9818 times |
Thu 31 July 2025 |
60.42 (-15.8%) |
68.18 |
60.42 - 68.18 |
0.7965 times |
Mon 30 June 2025 |
71.76 (-18.27%) |
87.00 |
58.55 - 103.40 |
1.5418 times |
Fri 30 May 2025 |
87.80 (-14.96%) |
101.20 |
87.80 - 101.20 |
0.4094 times |
Tue 29 April 2025 |
103.25 (-24.08%) |
129.20 |
81.60 - 129.20 |
1.7901 times |
Fri 28 March 2025 |
136.00 (-36.88%) |
204.70 |
136.00 - 204.70 |
0.0594 times |
Thu 27 February 2025 |
215.45 (-15.01%) |
243.50 |
215.45 - 243.50 |
0.0047 times |
Fri 31 January 2025 |
253.50 (34.16%) |
192.70 |
192.70 - 280.15 |
1.0156 times |
Tue 31 December 2024 |
188.95 (39.62%) |
138.00 |
138.00 - 188.95 |
1.1409 times |
DMA SMA EMA moving averages of Eastbuild 507917
DMA (daily moving average) of Eastbuild 507917
| DMA period | DMA value | | 5 day DMA | 53.83 | | 12 day DMA | 53.76 | | 20 day DMA | 55.92 | | 35 day DMA | 59.13 | | 50 day DMA | 58.16 | | 100 day DMA | 67.38 | | 150 day DMA | 103.54 | | 200 day DMA | 112.61 | EMA (exponential moving average) of Eastbuild 507917
| EMA period | EMA current | EMA prev | EMA prev2 | | 5 day EMA | 54.84 | 53.55 | 52.81 | | 12 day EMA | 54.86 | 54.39 | 54.27 | | 20 day EMA | 55.89 | 55.73 | 55.8 | | 35 day EMA | 56.7 | 56.66 | 56.76 | | 50 day EMA | 57.99 | 58.01 | 58.13 |
SMA (simple moving average) of Eastbuild 507917
| SMA period | SMA current | SMA prev | SMA prev2 | | 5 day SMA | 53.83 | 52.41 | 51.97 | | 12 day SMA | 53.76 | 53.87 | 54.17 | | 20 day SMA | 55.92 | 56.25 | 56.69 | | 35 day SMA | 59.13 | 59.15 | 59.15 | | 50 day SMA | 58.16 | 58.22 | 58.33 | | 100 day SMA | 67.38 | 67.75 | 68.18 | | 150 day SMA | 103.54 | 104.55 | 105.55 | | 200 day SMA | 112.61 | 112.7 | 112.79 |
|
|
