VipIndus 507880 full analysis,charts,indicators,moving averages,SMA,DMA,EMA,ADX,MACD,RSIVip Indus 507880 WideScreen charts, DMA,SMA,EMA technical analysis, forecast prediction, by indicators ADX,MACD,RSI,CCI BSE stock exchange
Daily price and charts and targets VipIndus Strong Daily Stock price targets for VipIndus 507880 are 434.85 and 439.8 | Daily Target 1 | 433.47 | | Daily Target 2 | 436.23 | | Daily Target 3 | 438.41666666667 | | Daily Target 4 | 441.18 | | Daily Target 5 | 443.37 |
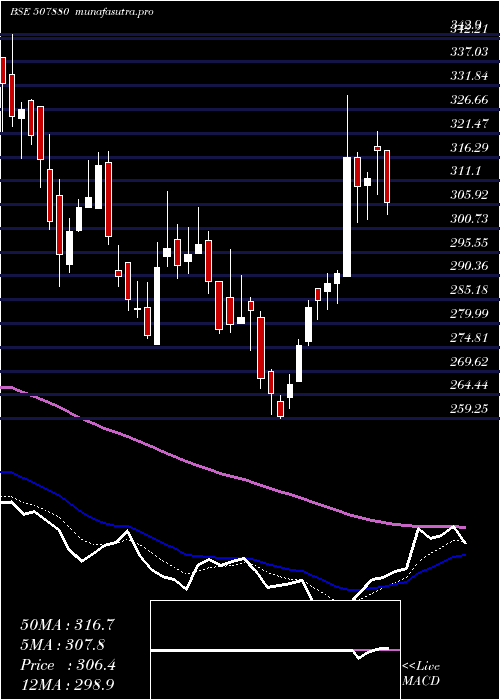
Daily price and volume Vip Indus
| Date |
Closing |
Open |
Range |
Volume |
Tue 21 October 2025 |
439.00 (1.47%) |
439.95 |
435.65 - 440.60 |
1.003 times |
Mon 20 October 2025 |
432.65 (1.29%) |
426.55 |
423.20 - 433.70 |
0.3143 times |
Fri 17 October 2025 |
427.15 (-0.33%) |
433.05 |
425.50 - 473.30 |
5.7506 times |
Thu 16 October 2025 |
428.55 (0.56%) |
426.25 |
425.25 - 433.05 |
0.2312 times |
Wed 15 October 2025 |
426.15 (1.07%) |
421.60 |
418.85 - 427.95 |
0.2027 times |
Tue 14 October 2025 |
421.65 (-1.55%) |
420.20 |
420.20 - 430.55 |
0.0852 times |
Mon 13 October 2025 |
428.30 (-1.02%) |
424.35 |
424.35 - 431.35 |
0.0939 times |
Fri 10 October 2025 |
432.70 (1.57%) |
425.55 |
425.50 - 435.00 |
0.2201 times |
Thu 09 October 2025 |
426.00 (1.06%) |
418.05 |
418.00 - 427.60 |
1.9783 times |
Wed 08 October 2025 |
421.55 (-1.92%) |
428.95 |
420.70 - 430.20 |
0.1207 times |
Tue 07 October 2025 |
429.80 (1.39%) |
422.55 |
422.55 - 430.80 |
0.1568 times |
Weekly price and charts VipIndus Strong weekly Stock price targets for VipIndus 507880 are 431.1 and 448.5 | Weekly Target 1 | 416.87 | | Weekly Target 2 | 427.93 | | Weekly Target 3 | 434.26666666667 | | Weekly Target 4 | 445.33 | | Weekly Target 5 | 451.67 |
Weekly price and volumes for Vip Indus
| Date |
Closing |
Open |
Range |
Volume |
Tue 21 October 2025 |
439.00 (2.77%) |
426.55 |
423.20 - 440.60 |
0.1044 times |
Fri 17 October 2025 |
427.15 (-1.28%) |
424.35 |
418.85 - 473.30 |
0.5044 times |
Fri 10 October 2025 |
432.70 (2.77%) |
418.20 |
418.00 - 435.00 |
0.2174 times |
Fri 03 October 2025 |
421.05 (2.95%) |
407.15 |
404.05 - 424.35 |
0.5453 times |
Fri 26 September 2025 |
409.00 (-9.19%) |
443.50 |
388.00 - 451.95 |
8.0706 times |
Fri 19 September 2025 |
450.40 (2.15%) |
440.05 |
435.80 - 454.00 |
0.2446 times |
Fri 12 September 2025 |
440.90 (4.28%) |
422.85 |
420.50 - 453.85 |
0.0906 times |
Fri 05 September 2025 |
422.80 (0.69%) |
411.60 |
411.60 - 441.05 |
0.0836 times |
Fri 29 August 2025 |
419.90 (-2.31%) |
428.75 |
408.35 - 435.05 |
0.0655 times |
Fri 22 August 2025 |
429.85 (4.84%) |
411.00 |
408.75 - 432.90 |
0.0736 times |
Thu 14 August 2025 |
410.00 (-3.7%) |
423.95 |
399.40 - 424.05 |
0.1012 times |

Monthly price and charts VipIndus Strong monthly Stock price targets for VipIndus 507880 are 424.78 and 487.53 | Monthly Target 1 | 378.2 | | Monthly Target 2 | 408.6 | | Monthly Target 3 | 440.95 | | Monthly Target 4 | 471.35 | | Monthly Target 5 | 503.7 |
Monthly price and volumes Vip Indus
| Date |
Closing |
Open |
Range |
Volume |
Tue 21 October 2025 |
439.00 (5.48%) |
410.55 |
410.55 - 473.30 |
0.7474 times |
Tue 30 September 2025 |
416.20 (-0.88%) |
411.60 |
388.00 - 454.00 |
4.7755 times |
Fri 29 August 2025 |
419.90 (-6.4%) |
440.05 |
399.40 - 465.85 |
0.2823 times |
Thu 31 July 2025 |
448.60 (6.43%) |
421.05 |
410.40 - 492.05 |
0.7885 times |
Mon 30 June 2025 |
421.50 (16.29%) |
362.00 |
341.90 - 439.60 |
0.7225 times |
Fri 30 May 2025 |
362.45 (18.31%) |
304.00 |
291.70 - 391.30 |
0.6084 times |
Wed 30 April 2025 |
306.35 (9.53%) |
280.10 |
259.25 - 329.60 |
0.3079 times |
Fri 28 March 2025 |
279.70 (-7.45%) |
307.90 |
275.35 - 317.45 |
0.5175 times |
Fri 28 February 2025 |
302.20 (-18.81%) |
373.40 |
300.50 - 398.70 |
0.543 times |
Fri 31 January 2025 |
372.20 (-22.63%) |
470.55 |
350.20 - 496.75 |
0.7069 times |
Tue 31 December 2024 |
481.05 (-6.43%) |
513.95 |
455.40 - 522.80 |
0.2431 times |

DMA SMA EMA moving averages of Vip Indus 507880
DMA (daily moving average) of Vip Indus 507880
| DMA period | DMA value | | 5 day DMA | 430.7 | | 12 day DMA | 428.12 | | 20 day DMA | 426.08 | | 35 day DMA | 431.93 | | 50 day DMA | 428.38 | | 100 day DMA | 426.68 | | 150 day DMA | 388.33 | | 200 day DMA | 389.58 | EMA (exponential moving average) of Vip Indus 507880
| EMA period | EMA current | EMA prev | EMA prev2 | | 5 day EMA | 432.19 | 428.78 | 426.84 | | 12 day EMA | 429.37 | 427.62 | 426.71 | | 20 day EMA | 429.24 | 428.21 | 427.74 | | 35 day EMA | 428.77 | 428.17 | 427.91 | | 50 day EMA | 430.45 | 430.1 | 430 |
SMA (simple moving average) of Vip Indus 507880
| SMA period | SMA current | SMA prev | SMA prev2 | | 5 day SMA | 430.7 | 427.23 | 426.36 | | 12 day SMA | 428.12 | 426.62 | 425.24 | | 20 day SMA | 426.08 | 426.53 | 427.42 | | 35 day SMA | 431.93 | 431.39 | 431.03 | | 50 day SMA | 428.38 | 428.6 | 428.78 | | 100 day SMA | 426.68 | 425.85 | 425.08 | | 150 day SMA | 388.33 | 387.43 | 386.55 | | 200 day SMA | 389.58 | 389.74 | 389.89 |
|
|
