KhaitanChem 507794 full analysis,charts,indicators,moving averages,SMA,DMA,EMA,ADX,MACD,RSIKhaitan Chem 507794 WideScreen charts, DMA,SMA,EMA technical analysis, forecast prediction, by indicators ADX,MACD,RSI,CCI BSE stock exchange
Daily price and charts and targets KhaitanChem Strong Daily Stock price targets for KhaitanChem 507794 are 84.43 and 88.37 | Daily Target 1 | 81.21 | | Daily Target 2 | 83.71 | | Daily Target 3 | 85.15 | | Daily Target 4 | 87.65 | | Daily Target 5 | 89.09 |
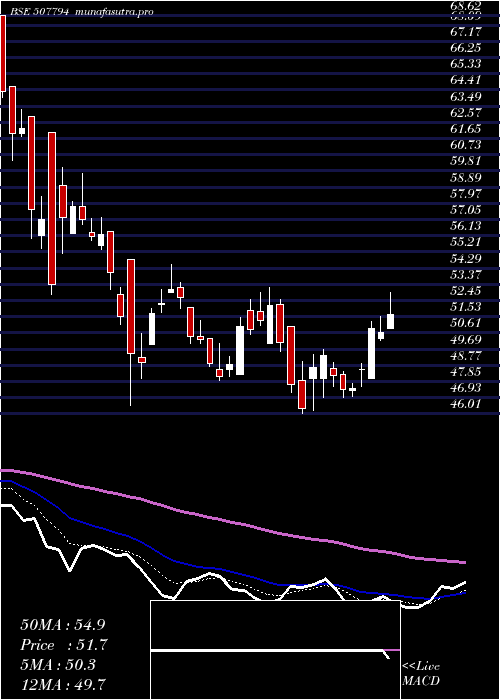
Daily price and volume Khaitan Chem
| Date |
Closing |
Open |
Range |
Volume |
Fri 05 December 2025 |
86.21 (3.79%) |
83.03 |
82.65 - 86.59 |
0.5065 times |
Thu 04 December 2025 |
83.06 (0.81%) |
82.26 |
82.00 - 84.13 |
2.4205 times |
Wed 03 December 2025 |
82.39 (-2.35%) |
84.00 |
82.26 - 84.34 |
0.4832 times |
Tue 02 December 2025 |
84.37 (-0.54%) |
84.83 |
84.00 - 85.05 |
0.5373 times |
Mon 01 December 2025 |
84.83 (0.87%) |
86.20 |
84.16 - 87.29 |
1.0065 times |
Fri 28 November 2025 |
84.10 (-0.59%) |
84.55 |
82.10 - 84.90 |
1.4355 times |
Thu 27 November 2025 |
84.60 (-1.34%) |
87.00 |
84.50 - 87.40 |
0.2679 times |
Wed 26 November 2025 |
85.75 (0.41%) |
86.40 |
85.00 - 88.40 |
1.3391 times |
Tue 25 November 2025 |
85.40 (0.23%) |
84.25 |
84.25 - 87.55 |
0.735 times |
Mon 24 November 2025 |
85.20 (-3.4%) |
88.20 |
84.40 - 89.25 |
1.2685 times |
Fri 21 November 2025 |
88.20 (-2.49%) |
90.15 |
87.90 - 90.15 |
0.8173 times |
Weekly price and charts KhaitanChem Strong weekly Stock price targets for KhaitanChem 507794 are 84.11 and 89.4 | Weekly Target 1 | 79.88 | | Weekly Target 2 | 83.04 | | Weekly Target 3 | 85.166666666667 | | Weekly Target 4 | 88.33 | | Weekly Target 5 | 90.46 |
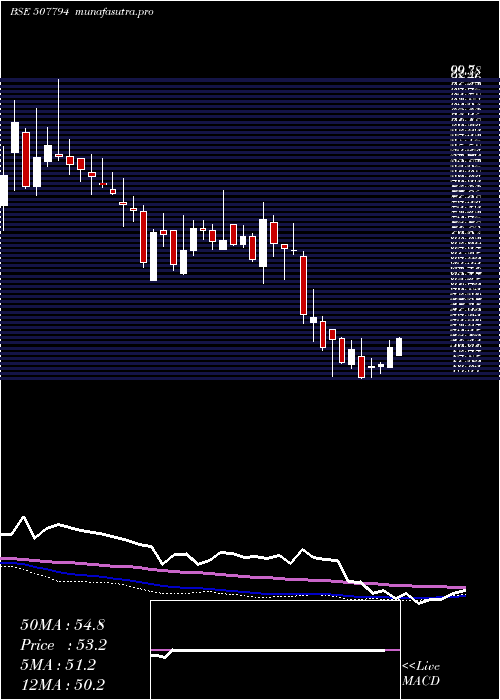
Weekly price and volumes for Khaitan Chem
| Date |
Closing |
Open |
Range |
Volume |
Fri 05 December 2025 |
86.21 (2.51%) |
86.20 |
82.00 - 87.29 |
0.3329 times |
Fri 28 November 2025 |
84.10 (-4.65%) |
88.20 |
82.10 - 89.25 |
0.3391 times |
Fri 21 November 2025 |
88.20 (-7.06%) |
81.10 |
81.10 - 97.00 |
0.4189 times |
Fri 14 November 2025 |
94.90 (-6.69%) |
102.20 |
94.60 - 103.25 |
0.4835 times |
Fri 07 November 2025 |
101.70 (-0.44%) |
102.40 |
98.80 - 108.80 |
1.1003 times |
Fri 31 October 2025 |
102.15 (-18.61%) |
125.05 |
101.40 - 132.95 |
4.4405 times |
Thu 23 October 2025 |
125.50 (1.66%) |
123.00 |
122.00 - 132.10 |
0.3203 times |
Fri 17 October 2025 |
123.45 (-0.2%) |
120.75 |
116.35 - 126.65 |
0.9083 times |
Fri 10 October 2025 |
123.70 (2.19%) |
120.20 |
118.95 - 129.85 |
0.9666 times |
Fri 03 October 2025 |
121.05 (2.11%) |
118.55 |
116.80 - 127.95 |
0.6896 times |
Fri 26 September 2025 |
118.55 (-7.81%) |
125.05 |
117.75 - 135.00 |
0.732 times |
Monthly price and charts KhaitanChem Strong monthly Stock price targets for KhaitanChem 507794 are 84.11 and 89.4 | Monthly Target 1 | 79.88 | | Monthly Target 2 | 83.04 | | Monthly Target 3 | 85.166666666667 | | Monthly Target 4 | 88.33 | | Monthly Target 5 | 90.46 |
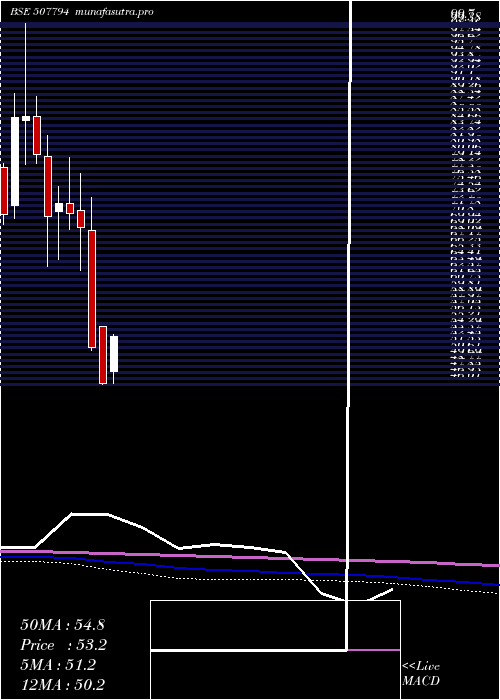
Monthly price and volumes Khaitan Chem
| Date |
Closing |
Open |
Range |
Volume |
Fri 05 December 2025 |
86.21 (2.51%) |
86.20 |
82.00 - 87.29 |
0.0689 times |
Fri 28 November 2025 |
84.10 (-17.67%) |
102.40 |
81.10 - 108.80 |
0.4843 times |
Fri 31 October 2025 |
102.15 (-16.37%) |
123.25 |
101.40 - 132.95 |
1.4009 times |
Tue 30 September 2025 |
122.15 (13.21%) |
111.95 |
110.65 - 136.00 |
2.1211 times |
Fri 29 August 2025 |
107.90 (-0.9%) |
109.95 |
99.65 - 113.00 |
0.5595 times |
Thu 31 July 2025 |
108.88 (17.86%) |
96.99 |
90.00 - 114.28 |
1.023 times |
Mon 30 June 2025 |
92.38 (17.03%) |
77.35 |
75.00 - 92.42 |
1.308 times |
Fri 30 May 2025 |
78.94 (46.08%) |
54.24 |
47.26 - 84.99 |
1.5249 times |
Wed 30 April 2025 |
54.04 (16.74%) |
48.00 |
46.21 - 64.20 |
0.7176 times |
Fri 28 March 2025 |
46.29 (-10.19%) |
54.77 |
46.01 - 54.77 |
0.7918 times |
Fri 28 February 2025 |
51.54 (-25.73%) |
69.00 |
51.10 - 73.85 |
0.4627 times |
DMA SMA EMA moving averages of Khaitan Chem 507794
DMA (daily moving average) of Khaitan Chem 507794
| DMA period | DMA value | | 5 day DMA | 84.17 | | 12 day DMA | 85.38 | | 20 day DMA | 89.94 | | 35 day DMA | 101.26 | | 50 day DMA | 108.09 | | 100 day DMA | 110.43 | | 150 day DMA | 99.42 | | 200 day DMA | 88.17 | EMA (exponential moving average) of Khaitan Chem 507794
| EMA period | EMA current | EMA prev | EMA prev2 | | 5 day EMA | 84.6 | 83.79 | 84.16 | | 12 day EMA | 86.78 | 86.88 | 87.57 | | 20 day EMA | 90.93 | 91.43 | 92.31 | | 35 day EMA | 98.83 | 99.57 | 100.54 | | 50 day EMA | 107.53 | 108.4 | 109.43 |
SMA (simple moving average) of Khaitan Chem 507794
| SMA period | SMA current | SMA prev | SMA prev2 | | 5 day SMA | 84.17 | 83.75 | 84.06 | | 12 day SMA | 85.38 | 85.82 | 86.66 | | 20 day SMA | 89.94 | 90.65 | 91.64 | | 35 day SMA | 101.26 | 102.29 | 103.45 | | 50 day SMA | 108.09 | 108.94 | 109.84 | | 100 day SMA | 110.43 | 110.51 | 110.65 | | 150 day SMA | 99.42 | 99.22 | 99.05 | | 200 day SMA | 88.17 | 88.08 | 88.01 |
|
|
