IfbAgro 507438 full analysis,charts,indicators,moving averages,SMA,DMA,EMA,ADX,MACD,RSIIfb Agro 507438 WideScreen charts, DMA,SMA,EMA technical analysis, forecast prediction, by indicators ADX,MACD,RSI,CCI BSE stock exchange
Daily price and charts and targets IfbAgro Strong Daily Stock price targets for IfbAgro 507438 are 975.38 and 1087.38 | Daily Target 1 | 954.58 | | Daily Target 2 | 996.17 | | Daily Target 3 | 1066.5833333333 | | Daily Target 4 | 1108.17 | | Daily Target 5 | 1178.58 |
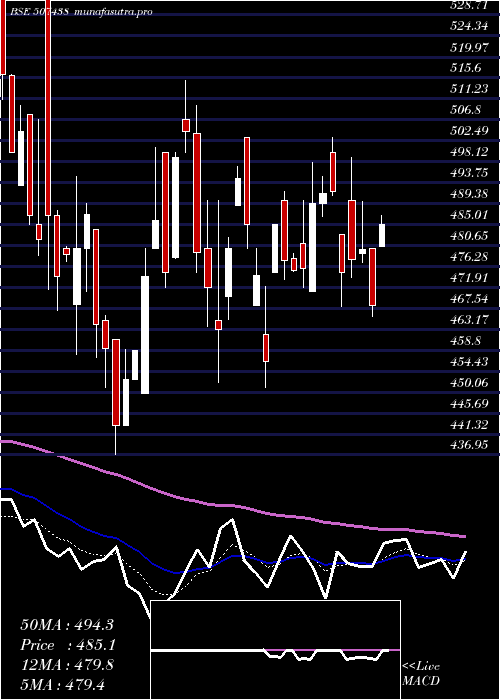
Daily price and volume Ifb Agro
| Date |
Closing |
Open |
Range |
Volume |
Thu 23 October 2025 |
1037.75 (-7.72%) |
1113.50 |
1025.00 - 1137.00 |
1.9149 times |
Tue 21 October 2025 |
1124.60 (7.92%) |
1060.25 |
1059.95 - 1136.80 |
1.3888 times |
Mon 20 October 2025 |
1042.10 (8.15%) |
958.30 |
958.30 - 1047.45 |
1.2777 times |
Fri 17 October 2025 |
963.55 (-2.33%) |
996.95 |
949.00 - 1000.90 |
0.2271 times |
Thu 16 October 2025 |
986.55 (6.13%) |
955.85 |
955.85 - 1060.45 |
3.0409 times |
Wed 15 October 2025 |
929.60 (0.55%) |
918.00 |
881.60 - 933.55 |
0.275 times |
Tue 14 October 2025 |
924.50 (-3.36%) |
959.70 |
912.95 - 959.70 |
0.1938 times |
Mon 13 October 2025 |
956.65 (-1.6%) |
992.25 |
952.30 - 992.25 |
0.1429 times |
Fri 10 October 2025 |
972.20 (-1.19%) |
1023.35 |
955.00 - 1049.90 |
0.9753 times |
Thu 09 October 2025 |
983.90 (2.11%) |
963.60 |
934.45 - 999.80 |
0.5637 times |
Wed 08 October 2025 |
963.60 (7.04%) |
933.00 |
933.00 - 1018.40 |
4.0788 times |
Weekly price and charts IfbAgro Strong weekly Stock price targets for IfbAgro 507438 are 998.03 and 1176.73 | Weekly Target 1 | 865.65 | | Weekly Target 2 | 951.7 | | Weekly Target 3 | 1044.35 | | Weekly Target 4 | 1130.4 | | Weekly Target 5 | 1223.05 |
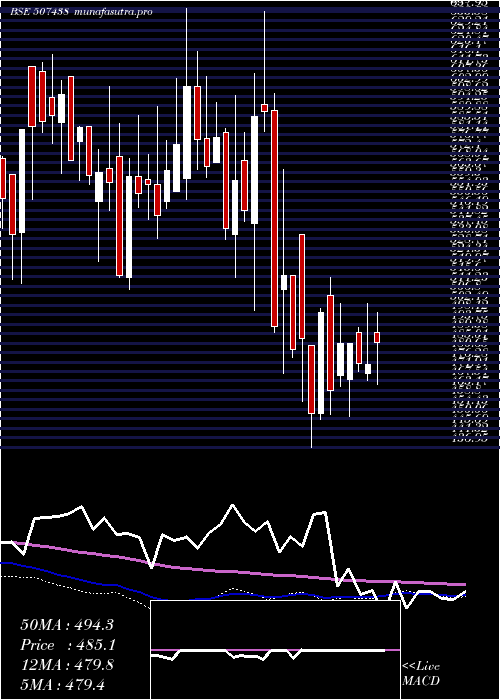
Weekly price and volumes for Ifb Agro
| Date |
Closing |
Open |
Range |
Volume |
Thu 23 October 2025 |
1037.75 (7.7%) |
958.30 |
958.30 - 1137.00 |
1.9283 times |
Fri 17 October 2025 |
963.55 (-0.89%) |
992.25 |
881.60 - 1060.45 |
1.633 times |
Fri 10 October 2025 |
972.20 (10.9%) |
879.05 |
869.65 - 1049.90 |
2.5018 times |
Fri 03 October 2025 |
876.65 (6.92%) |
833.50 |
810.00 - 903.65 |
1.1263 times |
Fri 26 September 2025 |
819.90 (4.37%) |
785.60 |
772.25 - 854.40 |
0.9405 times |
Fri 19 September 2025 |
785.60 (0.51%) |
756.20 |
756.20 - 804.00 |
0.2311 times |
Fri 12 September 2025 |
781.65 (0.08%) |
794.00 |
755.45 - 799.00 |
0.7399 times |
Fri 05 September 2025 |
781.00 (4.52%) |
784.50 |
720.20 - 828.00 |
0.2439 times |
Fri 29 August 2025 |
747.20 (-8.45%) |
820.25 |
747.00 - 820.25 |
0.1858 times |
Fri 22 August 2025 |
816.20 (7.9%) |
748.05 |
748.05 - 826.00 |
0.4696 times |
Thu 14 August 2025 |
756.45 (-2.56%) |
776.50 |
746.60 - 799.80 |
0.4076 times |
Monthly price and charts IfbAgro Strong monthly Stock price targets for IfbAgro 507438 are 935.63 and 1239.13 | Monthly Target 1 | 699.25 | | Monthly Target 2 | 868.5 | | Monthly Target 3 | 1002.75 | | Monthly Target 4 | 1172 | | Monthly Target 5 | 1306.25 |
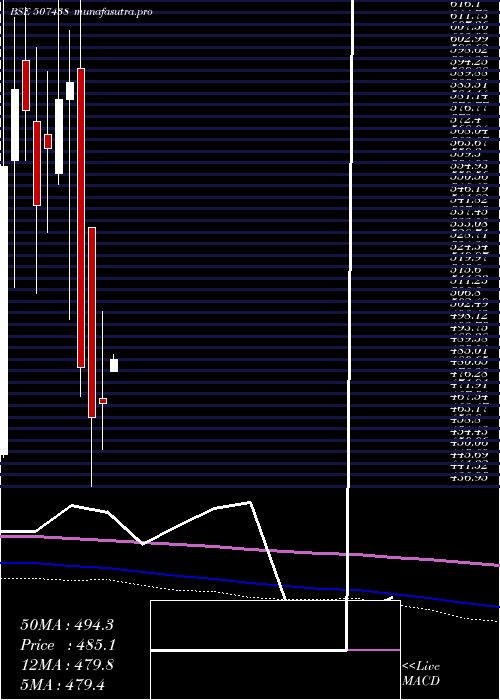
Monthly price and volumes Ifb Agro
| Date |
Closing |
Open |
Range |
Volume |
Thu 23 October 2025 |
1037.75 (26.6%) |
833.50 |
833.50 - 1137.00 |
1.5338 times |
Tue 30 September 2025 |
819.70 (9.7%) |
784.50 |
720.20 - 854.40 |
0.6784 times |
Fri 29 August 2025 |
747.20 (-19.4%) |
927.00 |
746.60 - 927.00 |
0.5194 times |
Thu 31 July 2025 |
927.00 (22.47%) |
745.00 |
692.00 - 929.00 |
1.0447 times |
Mon 30 June 2025 |
756.90 (8.68%) |
720.00 |
703.00 - 835.70 |
2.212 times |
Fri 30 May 2025 |
696.45 (48.77%) |
480.50 |
467.50 - 714.00 |
2.011 times |
Wed 30 April 2025 |
468.15 (1.09%) |
470.05 |
451.00 - 503.20 |
0.2476 times |
Fri 28 March 2025 |
463.10 (-3.9%) |
535.00 |
436.95 - 535.00 |
0.6343 times |
Fri 28 February 2025 |
481.90 (-18.25%) |
595.00 |
471.00 - 638.00 |
0.4018 times |
Fri 31 January 2025 |
589.50 (1.1%) |
583.10 |
500.10 - 609.20 |
0.717 times |
Tue 31 December 2024 |
583.10 (3.29%) |
555.05 |
551.00 - 639.00 |
1.3791 times |
DMA SMA EMA moving averages of Ifb Agro 507438
DMA (daily moving average) of Ifb Agro 507438
| DMA period | DMA value | | 5 day DMA | 1030.91 | | 12 day DMA | 982.1 | | 20 day DMA | 927.34 | | 35 day DMA | 866.31 | | 50 day DMA | 840.91 | | 100 day DMA | 802.17 | | 150 day DMA | 697.55 | | 200 day DMA | 660.65 | EMA (exponential moving average) of Ifb Agro 507438
| EMA period | EMA current | EMA prev | EMA prev2 | | 5 day EMA | 1033.71 | 1031.69 | 985.24 | | 12 day EMA | 983.84 | 974.04 | 946.67 | | 20 day EMA | 944.18 | 934.34 | 914.32 | | 35 day EMA | 899.76 | 891.64 | 877.92 | | 50 day EMA | 858.39 | 851.07 | 839.91 |
SMA (simple moving average) of Ifb Agro 507438
| SMA period | SMA current | SMA prev | SMA prev2 | | 5 day SMA | 1030.91 | 1009.28 | 969.26 | | 12 day SMA | 982.1 | 969.68 | 949.02 | | 20 day SMA | 927.34 | 916.14 | 898.66 | | 35 day SMA | 866.31 | 858.66 | 848.5 | | 50 day SMA | 840.91 | 835.69 | 829.43 | | 100 day SMA | 802.17 | 797.72 | 792.31 | | 150 day SMA | 697.55 | 693.88 | 689.59 | | 200 day SMA | 660.65 | 658.41 | 655.79 |
|
|
