Ravalgaon 507300 full analysis,charts,indicators,moving averages,SMA,DMA,EMA,ADX,MACD,RSIRavalgaon 507300 WideScreen charts, DMA,SMA,EMA technical analysis, forecast prediction, by indicators ADX,MACD,RSI,CCI BSE stock exchange
Daily price and charts and targets Ravalgaon Strong Daily Stock price targets for Ravalgaon 507300 are 1039.98 and 1069.93 | Daily Target 1 | 1015.02 | | Daily Target 2 | 1034.98 | | Daily Target 3 | 1044.9666666667 | | Daily Target 4 | 1064.93 | | Daily Target 5 | 1074.92 |
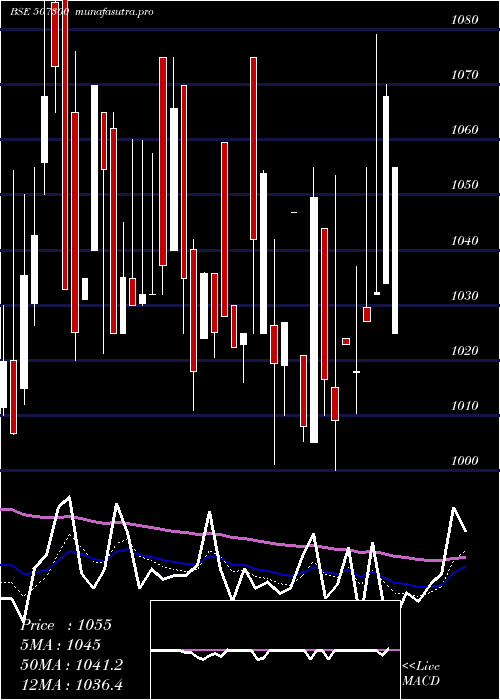
Daily price and volume Ravalgaon
| Date |
Closing |
Open |
Range |
Volume |
Thu 23 October 2025 |
1054.95 (-1.21%) |
1025.00 |
1025.00 - 1054.95 |
0.0755 times |
Tue 21 October 2025 |
1067.85 (3.44%) |
1034.00 |
1034.00 - 1070.00 |
0.085 times |
Mon 20 October 2025 |
1032.35 (0.52%) |
1032.00 |
1032.00 - 1079.00 |
0.3305 times |
Fri 17 October 2025 |
1027.00 (0.88%) |
1029.70 |
1027.00 - 1055.00 |
1.8414 times |
Thu 16 October 2025 |
1018.00 (-0.49%) |
1017.90 |
1010.50 - 1037.00 |
0.3116 times |
Wed 15 October 2025 |
1023.00 (1.37%) |
1023.95 |
1023.00 - 1023.95 |
2.3418 times |
Tue 14 October 2025 |
1009.20 (-0.73%) |
1015.05 |
1000.00 - 1053.50 |
2.238 times |
Mon 13 October 2025 |
1016.65 (-3.13%) |
1044.00 |
1010.00 - 1044.00 |
0.831 times |
Fri 10 October 2025 |
1049.50 (4.11%) |
1005.10 |
1005.10 - 1055.00 |
1.3126 times |
Thu 09 October 2025 |
1008.05 (-3.7%) |
1021.05 |
1005.30 - 1021.05 |
0.6327 times |
Wed 08 October 2025 |
1046.80 (1.95%) |
1046.80 |
1046.80 - 1046.80 |
0.0283 times |
Weekly price and charts Ravalgaon Strong weekly Stock price targets for Ravalgaon 507300 are 1039.98 and 1093.98 | Weekly Target 1 | 998.98 | | Weekly Target 2 | 1026.97 | | Weekly Target 3 | 1052.9833333333 | | Weekly Target 4 | 1080.97 | | Weekly Target 5 | 1106.98 |
Weekly price and volumes for Ravalgaon
| Date |
Closing |
Open |
Range |
Volume |
Thu 23 October 2025 |
1054.95 (2.72%) |
1032.00 |
1025.00 - 1079.00 |
0.1351 times |
Fri 17 October 2025 |
1027.00 (-2.14%) |
1044.00 |
1000.00 - 1055.00 |
2.0811 times |
Fri 10 October 2025 |
1049.50 (-0.42%) |
1026.30 |
1001.30 - 1055.00 |
1.1328 times |
Fri 03 October 2025 |
1053.95 (2.52%) |
1030.00 |
1016.00 - 1075.00 |
0.6105 times |
Fri 26 September 2025 |
1028.00 (-3.53%) |
1069.95 |
1011.00 - 1069.95 |
0.8807 times |
Fri 19 September 2025 |
1065.65 (2.96%) |
1035.00 |
1030.00 - 1075.00 |
1.047 times |
Fri 12 September 2025 |
1035.05 (0.97%) |
1031.00 |
1021.30 - 1069.90 |
0.3585 times |
Fri 05 September 2025 |
1025.10 (-1%) |
1030.35 |
1020.00 - 1095.45 |
1.112 times |
Fri 29 August 2025 |
1035.50 (-1.93%) |
1030.00 |
1006.70 - 1054.50 |
0.9535 times |
Fri 22 August 2025 |
1055.85 (3.22%) |
1022.00 |
1001.00 - 1075.00 |
1.6888 times |
Thu 14 August 2025 |
1022.95 (-2.25%) |
1060.00 |
1000.00 - 1079.95 |
1.2653 times |

Monthly price and charts Ravalgaon Strong monthly Stock price targets for Ravalgaon 507300 are 987.98 and 1066.98 | Monthly Target 1 | 965.65 | | Monthly Target 2 | 1010.3 | | Monthly Target 3 | 1044.65 | | Monthly Target 4 | 1089.3 | | Monthly Target 5 | 1123.65 |
Monthly price and volumes Ravalgaon
| Date |
Closing |
Open |
Range |
Volume |
Thu 23 October 2025 |
1054.95 (2.92%) |
1075.00 |
1000.00 - 1079.00 |
0.5921 times |
Tue 30 September 2025 |
1025.00 (-1.01%) |
1030.35 |
1011.00 - 1095.45 |
0.5463 times |
Fri 29 August 2025 |
1035.50 (-2.31%) |
1239.00 |
1000.00 - 1239.00 |
0.818 times |
Thu 31 July 2025 |
1060.00 (-1.89%) |
1075.00 |
1025.00 - 1170.00 |
0.8618 times |
Mon 30 June 2025 |
1080.40 (2.07%) |
1063.75 |
999.95 - 1115.00 |
1.1098 times |
Fri 30 May 2025 |
1058.50 (-1.29%) |
1065.00 |
1026.30 - 1155.00 |
1.0829 times |
Wed 30 April 2025 |
1072.30 (-2.43%) |
1100.00 |
1060.00 - 1190.00 |
0.828 times |
Fri 28 March 2025 |
1099.05 (4.57%) |
1028.30 |
1011.00 - 1224.00 |
1.7369 times |
Fri 28 February 2025 |
1051.00 (-9.6%) |
1210.00 |
1024.20 - 1228.00 |
0.9916 times |
Fri 31 January 2025 |
1162.55 (-18.2%) |
1425.00 |
1045.00 - 1470.00 |
1.4326 times |
Tue 31 December 2024 |
1421.20 (-11.56%) |
1624.00 |
1332.50 - 1800.00 |
1.0785 times |

DMA SMA EMA moving averages of Ravalgaon 507300
DMA (daily moving average) of Ravalgaon 507300
| DMA period | DMA value | | 5 day DMA | 1040.03 | | 12 day DMA | 1031.68 | | 20 day DMA | 1031.58 | | 35 day DMA | 1035.22 | | 50 day DMA | 1035.15 | | 100 day DMA | 1056.37 | | 150 day DMA | 1070.62 | | 200 day DMA | 1103.01 | EMA (exponential moving average) of Ravalgaon 507300
| EMA period | EMA current | EMA prev | EMA prev2 | | 5 day EMA | 1044.98 | 1040 | 1026.07 | | 12 day EMA | 1036.44 | 1033.08 | 1026.76 | | 20 day EMA | 1034.81 | 1032.69 | 1028.99 | | 35 day EMA | 1036 | 1034.88 | 1032.94 | | 50 day EMA | 1039.01 | 1038.36 | 1037.16 |
SMA (simple moving average) of Ravalgaon 507300
| SMA period | SMA current | SMA prev | SMA prev2 | | 5 day SMA | 1040.03 | 1033.64 | 1021.91 | | 12 day SMA | 1031.68 | 1028.72 | 1027.56 | | 20 day SMA | 1031.58 | 1029.74 | 1028.1 | | 35 day SMA | 1035.22 | 1035.59 | 1034.87 | | 50 day SMA | 1035.15 | 1034.98 | 1035.42 | | 100 day SMA | 1056.37 | 1056.49 | 1056.72 | | 150 day SMA | 1070.62 | 1070.79 | 1070.9 | | 200 day SMA | 1103.01 | 1104.99 | 1107.01 |
|
|
