TilaknagInd 507205 full analysis,charts,indicators,moving averages,SMA,DMA,EMA,ADX,MACD,RSITilaknag Ind 507205 WideScreen charts, DMA,SMA,EMA technical analysis, forecast prediction, by indicators ADX,MACD,RSI,CCI BSE stock exchange
Daily price and charts and targets TilaknagInd Strong Daily Stock price targets for TilaknagInd 507205 are 450.8 and 457.05 | Daily Target 1 | 446.28 | | Daily Target 2 | 449.07 | | Daily Target 3 | 452.53333333333 | | Daily Target 4 | 455.32 | | Daily Target 5 | 458.78 |
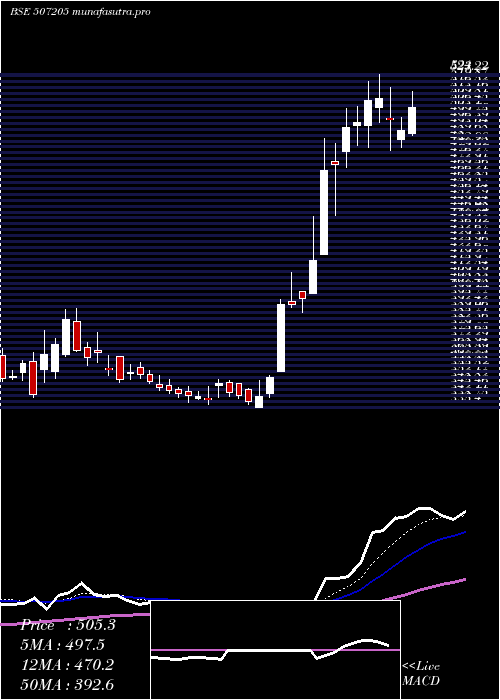
Daily price and volume Tilaknag Ind
| Date |
Closing |
Open |
Range |
Volume |
Fri 05 December 2025 |
451.85 (0.03%) |
450.80 |
449.75 - 456.00 |
0.7763 times |
Thu 04 December 2025 |
451.70 (-2.04%) |
460.05 |
445.00 - 463.25 |
1.5224 times |
Wed 03 December 2025 |
461.10 (-2.27%) |
473.65 |
455.40 - 474.70 |
0.9329 times |
Tue 02 December 2025 |
471.80 (-0.05%) |
477.85 |
462.95 - 477.85 |
0.9207 times |
Mon 01 December 2025 |
472.05 (-0.61%) |
479.70 |
467.65 - 500.00 |
1.8174 times |
Fri 28 November 2025 |
474.95 (1.1%) |
470.30 |
468.15 - 479.70 |
1.0206 times |
Thu 27 November 2025 |
469.80 (-0.67%) |
473.00 |
464.20 - 478.50 |
0.62 times |
Wed 26 November 2025 |
472.95 (0.5%) |
475.85 |
470.00 - 475.85 |
0.3494 times |
Tue 25 November 2025 |
470.60 (-0.98%) |
476.85 |
469.55 - 478.15 |
0.5366 times |
Mon 24 November 2025 |
475.25 (-2.16%) |
487.80 |
471.15 - 491.45 |
1.5036 times |
Fri 21 November 2025 |
485.75 (-3.47%) |
506.00 |
482.20 - 508.30 |
0.7585 times |
Weekly price and charts TilaknagInd Strong weekly Stock price targets for TilaknagInd 507205 are 420.93 and 475.93 | Weekly Target 1 | 410.62 | | Weekly Target 2 | 431.23 | | Weekly Target 3 | 465.61666666667 | | Weekly Target 4 | 486.23 | | Weekly Target 5 | 520.62 |
Weekly price and volumes for Tilaknag Ind
| Date |
Closing |
Open |
Range |
Volume |
Fri 05 December 2025 |
451.85 (-4.86%) |
479.70 |
445.00 - 500.00 |
0.8344 times |
Fri 28 November 2025 |
474.95 (-2.22%) |
487.80 |
464.20 - 491.45 |
0.5633 times |
Fri 21 November 2025 |
485.75 (-0.39%) |
491.45 |
479.70 - 520.00 |
0.9485 times |
Fri 14 November 2025 |
487.65 (-2.65%) |
503.75 |
461.45 - 522.00 |
1.649 times |
Fri 07 November 2025 |
500.95 (-5.16%) |
533.30 |
485.20 - 537.60 |
0.8367 times |
Fri 31 October 2025 |
528.20 (10.01%) |
469.55 |
469.55 - 550.00 |
3.0977 times |
Thu 23 October 2025 |
480.15 (2.16%) |
469.65 |
467.00 - 499.90 |
0.5582 times |
Fri 17 October 2025 |
470.00 (3.64%) |
448.00 |
441.15 - 482.00 |
0.6079 times |
Fri 10 October 2025 |
453.50 (-3.27%) |
477.70 |
452.25 - 477.90 |
0.4301 times |
Fri 03 October 2025 |
468.85 (6.01%) |
444.00 |
436.30 - 470.30 |
0.4741 times |
Fri 26 September 2025 |
442.25 (-3.71%) |
456.55 |
440.05 - 470.20 |
0.8575 times |

Monthly price and charts TilaknagInd Strong monthly Stock price targets for TilaknagInd 507205 are 420.93 and 475.93 | Monthly Target 1 | 410.62 | | Monthly Target 2 | 431.23 | | Monthly Target 3 | 465.61666666667 | | Monthly Target 4 | 486.23 | | Monthly Target 5 | 520.62 |
Monthly price and volumes Tilaknag Ind
| Date |
Closing |
Open |
Range |
Volume |
Fri 05 December 2025 |
451.85 (-4.86%) |
479.70 |
445.00 - 500.00 |
0.1379 times |
Fri 28 November 2025 |
474.95 (-10.08%) |
533.30 |
461.45 - 537.60 |
0.6604 times |
Fri 31 October 2025 |
528.20 (17.7%) |
443.45 |
441.15 - 550.00 |
0.8186 times |
Tue 30 September 2025 |
448.75 (-5.32%) |
474.05 |
436.30 - 488.00 |
0.7064 times |
Fri 29 August 2025 |
473.95 (-3.75%) |
490.75 |
464.00 - 529.90 |
1.0795 times |
Thu 31 July 2025 |
492.40 (41.94%) |
347.55 |
335.40 - 524.00 |
3.763 times |
Mon 30 June 2025 |
346.90 (-6.63%) |
374.65 |
340.80 - 391.20 |
0.7668 times |
Fri 30 May 2025 |
371.55 (29.75%) |
281.05 |
250.50 - 376.50 |
1.1466 times |
Wed 30 April 2025 |
286.35 (20.59%) |
236.50 |
227.55 - 313.65 |
0.4524 times |
Fri 28 March 2025 |
237.45 (7.18%) |
224.80 |
210.75 - 267.25 |
0.4687 times |
Fri 28 February 2025 |
221.55 (-39.68%) |
384.90 |
213.05 - 413.95 |
0.8801 times |

DMA SMA EMA moving averages of Tilaknag Ind 507205
DMA (daily moving average) of Tilaknag Ind 507205
| DMA period | DMA value | | 5 day DMA | 461.7 | | 12 day DMA | 471.75 | | 20 day DMA | 482.21 | | 35 day DMA | 486.4 | | 50 day DMA | 477.88 | | 100 day DMA | 472.11 | | 150 day DMA | 428.37 | | 200 day DMA | 386.35 | EMA (exponential moving average) of Tilaknag Ind 507205
| EMA period | EMA current | EMA prev | EMA prev2 | | 5 day EMA | 459.6 | 463.47 | 469.36 | | 12 day EMA | 469.66 | 472.9 | 476.75 | | 20 day EMA | 475.61 | 478.11 | 480.89 | | 35 day EMA | 476.07 | 477.5 | 479.02 | | 50 day EMA | 475.42 | 476.38 | 477.39 |
SMA (simple moving average) of Tilaknag Ind 507205
| SMA period | SMA current | SMA prev | SMA prev2 | | 5 day SMA | 461.7 | 466.32 | 469.94 | | 12 day SMA | 471.75 | 474.92 | 477.83 | | 20 day SMA | 482.21 | 484.1 | 486.73 | | 35 day SMA | 486.4 | 486.42 | 486.47 | | 50 day SMA | 477.88 | 478.03 | 478.37 | | 100 day SMA | 472.11 | 471.02 | 470 | | 150 day SMA | 428.37 | 427.35 | 426.24 | | 200 day SMA | 386.35 | 386.09 | 385.67 |
|
|
