GujPetro 506858 full analysis,charts,indicators,moving averages,SMA,DMA,EMA,ADX,MACD,RSIGuj Petro 506858 WideScreen charts, DMA,SMA,EMA technical analysis, forecast prediction, by indicators ADX,MACD,RSI,CCI BSE stock exchange
Daily price and charts and targets GujPetro Strong Daily Stock price targets for GujPetro 506858 are 61.01 and 65 | Daily Target 1 | 60.31 | | Daily Target 2 | 61.7 | | Daily Target 3 | 64.296666666667 | | Daily Target 4 | 65.69 | | Daily Target 5 | 68.29 |
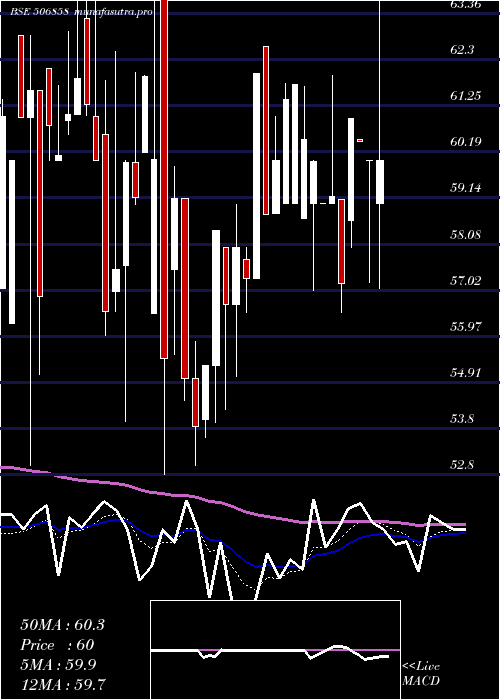
Daily price and volume Guj Petro
| Date |
Closing |
Open |
Range |
Volume |
Tue 21 October 2025 |
63.10 (0.32%) |
66.89 |
62.90 - 66.89 |
0.0191 times |
Mon 20 October 2025 |
62.90 (0.64%) |
63.50 |
58.00 - 66.99 |
0.518 times |
Fri 17 October 2025 |
62.50 (0.64%) |
65.00 |
62.00 - 65.00 |
0.6144 times |
Thu 16 October 2025 |
62.10 (-1.22%) |
63.95 |
62.05 - 63.96 |
2.4137 times |
Wed 15 October 2025 |
62.87 (1.98%) |
61.75 |
61.75 - 63.97 |
1.4051 times |
Tue 14 October 2025 |
61.65 (-2.36%) |
63.00 |
60.30 - 63.00 |
1.1396 times |
Mon 13 October 2025 |
63.14 (1.06%) |
62.48 |
62.48 - 64.39 |
1.4575 times |
Fri 10 October 2025 |
62.48 (-3.06%) |
63.94 |
62.40 - 63.94 |
0.3894 times |
Thu 09 October 2025 |
64.45 (0.78%) |
61.56 |
61.00 - 64.45 |
1.7826 times |
Wed 08 October 2025 |
63.95 (3.13%) |
61.06 |
61.06 - 64.99 |
0.2608 times |
Tue 07 October 2025 |
62.01 (-1.59%) |
63.01 |
61.16 - 63.84 |
0.2524 times |
Weekly price and charts GujPetro Strong weekly Stock price targets for GujPetro 506858 are 56.06 and 65.05 | Weekly Target 1 | 53.71 | | Weekly Target 2 | 58.4 | | Weekly Target 3 | 62.696666666667 | | Weekly Target 4 | 67.39 | | Weekly Target 5 | 71.69 |
Weekly price and volumes for Guj Petro
| Date |
Closing |
Open |
Range |
Volume |
Tue 21 October 2025 |
63.10 (0.96%) |
63.50 |
58.00 - 66.99 |
0.1051 times |
Fri 17 October 2025 |
62.50 (0.03%) |
62.48 |
60.30 - 65.00 |
1.3758 times |
Fri 10 October 2025 |
62.48 (-6.12%) |
61.00 |
61.00 - 65.45 |
1.1752 times |
Fri 03 October 2025 |
66.55 (2.21%) |
68.00 |
60.00 - 68.00 |
0.193 times |
Fri 26 September 2025 |
65.11 (-6.38%) |
69.00 |
59.55 - 73.00 |
1.4185 times |
Fri 19 September 2025 |
69.55 (9.96%) |
66.50 |
61.00 - 81.51 |
1.8032 times |
Fri 12 September 2025 |
63.25 (-1.17%) |
64.25 |
62.30 - 66.00 |
0.5996 times |
Fri 05 September 2025 |
64.00 (4.49%) |
62.00 |
62.00 - 69.00 |
1.3015 times |
Fri 29 August 2025 |
61.25 (-3.92%) |
62.00 |
60.00 - 65.00 |
0.587 times |
Fri 22 August 2025 |
63.75 (1.37%) |
62.89 |
61.00 - 64.50 |
1.4411 times |
Thu 14 August 2025 |
62.89 (3.45%) |
61.00 |
60.00 - 65.60 |
2.6053 times |

Monthly price and charts GujPetro Strong monthly Stock price targets for GujPetro 506858 are 55.55 and 65.55 | Monthly Target 1 | 53.03 | | Monthly Target 2 | 58.07 | | Monthly Target 3 | 63.033333333333 | | Monthly Target 4 | 68.07 | | Monthly Target 5 | 73.03 |
Monthly price and volumes Guj Petro
| Date |
Closing |
Open |
Range |
Volume |
Tue 21 October 2025 |
63.10 (-2.92%) |
65.00 |
58.00 - 68.00 |
0.5218 times |
Tue 30 September 2025 |
65.00 (6.12%) |
62.00 |
59.55 - 81.51 |
0.9846 times |
Fri 29 August 2025 |
61.25 (0.51%) |
62.00 |
59.75 - 71.99 |
1.0289 times |
Thu 31 July 2025 |
60.94 (-6.25%) |
64.68 |
58.50 - 66.00 |
0.9739 times |
Mon 30 June 2025 |
65.00 (3.95%) |
62.25 |
56.00 - 67.00 |
0.8662 times |
Fri 30 May 2025 |
62.53 (10.81%) |
56.50 |
52.06 - 69.50 |
1.3764 times |
Wed 30 April 2025 |
56.43 (-8.08%) |
59.01 |
54.00 - 67.95 |
1.169 times |
Fri 28 March 2025 |
61.39 (8.56%) |
57.00 |
52.80 - 65.00 |
1.6126 times |
Fri 28 February 2025 |
56.55 (-2.25%) |
59.35 |
53.01 - 64.50 |
0.6151 times |
Fri 31 January 2025 |
57.85 (-15.78%) |
69.00 |
52.10 - 70.99 |
0.8514 times |
Tue 31 December 2024 |
68.69 (2.52%) |
67.00 |
64.00 - 81.00 |
1.1593 times |

DMA SMA EMA moving averages of Guj Petro 506858
DMA (daily moving average) of Guj Petro 506858
| DMA period | DMA value | | 5 day DMA | 62.69 | | 12 day DMA | 62.85 | | 20 day DMA | 64.34 | | 35 day DMA | 64.66 | | 50 day DMA | 64.09 | | 100 day DMA | 63.04 | | 150 day DMA | 61.94 | | 200 day DMA | 62.17 | EMA (exponential moving average) of Guj Petro 506858
| EMA period | EMA current | EMA prev | EMA prev2 | | 5 day EMA | 62.81 | 62.67 | 62.56 | | 12 day EMA | 63.23 | 63.25 | 63.31 | | 20 day EMA | 63.69 | 63.75 | 63.84 | | 35 day EMA | 63.73 | 63.77 | 63.82 | | 50 day EMA | 63.78 | 63.81 | 63.85 |
SMA (simple moving average) of Guj Petro 506858
| SMA period | SMA current | SMA prev | SMA prev2 | | 5 day SMA | 62.69 | 62.4 | 62.45 | | 12 day SMA | 62.85 | 63.13 | 63.27 | | 20 day SMA | 64.34 | 64.58 | 64.91 | | 35 day SMA | 64.66 | 64.67 | 64.63 | | 50 day SMA | 64.09 | 64.04 | 64.04 | | 100 day SMA | 63.04 | 63.04 | 63.05 | | 150 day SMA | 61.94 | 61.91 | 61.89 | | 200 day SMA | 62.17 | 62.2 | 62.22 |
|
|
