MysPetro 506734 full analysis,charts,indicators,moving averages,SMA,DMA,EMA,ADX,MACD,RSIMys Petro 506734 WideScreen charts, DMA,SMA,EMA technical analysis, forecast prediction, by indicators ADX,MACD,RSI,CCI BSE stock exchange
Daily price and charts and targets MysPetro Strong Daily Stock price targets for MysPetro 506734 are 122.93 and 126.78 | Daily Target 1 | 122.03 | | Daily Target 2 | 123.82 | | Daily Target 3 | 125.88333333333 | | Daily Target 4 | 127.67 | | Daily Target 5 | 129.73 |
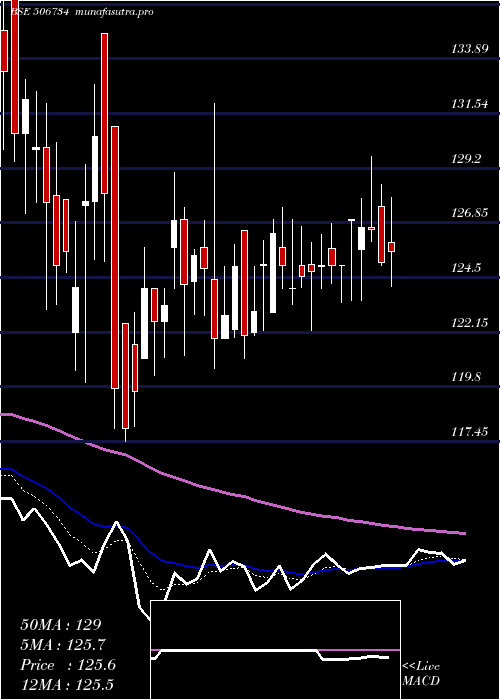
Daily price and volume Mys Petro
| Date |
Closing |
Open |
Range |
Volume |
Fri 23 May 2025 |
125.60 (0.36%) |
126.00 |
124.10 - 127.95 |
1.6833 times |
Thu 22 May 2025 |
125.15 (-1.11%) |
127.55 |
125.00 - 128.50 |
1.0507 times |
Wed 21 May 2025 |
126.55 (-0.08%) |
126.65 |
126.05 - 129.70 |
0.2004 times |
Tue 20 May 2025 |
126.65 (-0.28%) |
125.70 |
123.50 - 127.90 |
1.3199 times |
Mon 19 May 2025 |
127.00 (1.6%) |
126.95 |
123.50 - 127.00 |
0.7682 times |
Fri 16 May 2025 |
125.00 (0%) |
125.00 |
123.40 - 125.00 |
0.8422 times |
Thu 15 May 2025 |
125.00 (0%) |
125.75 |
124.25 - 126.80 |
1.1121 times |
Wed 14 May 2025 |
125.00 (0.2%) |
124.95 |
124.00 - 126.35 |
1.4331 times |
Tue 13 May 2025 |
124.75 (0.16%) |
125.05 |
122.20 - 126.00 |
0.7433 times |
Mon 12 May 2025 |
124.55 (0.44%) |
125.00 |
124.05 - 126.70 |
0.8469 times |
Fri 09 May 2025 |
124.00 (-0.8%) |
124.00 |
123.35 - 127.00 |
0.5149 times |
Weekly price and charts MysPetro Strong weekly Stock price targets for MysPetro 506734 are 121.45 and 127.65 | Weekly Target 1 | 120.07 | | Weekly Target 2 | 122.83 | | Weekly Target 3 | 126.26666666667 | | Weekly Target 4 | 129.03 | | Weekly Target 5 | 132.47 |
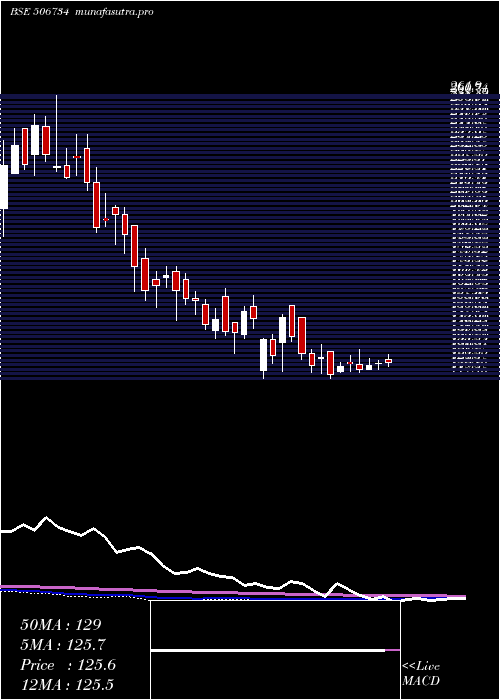
Weekly price and volumes for Mys Petro
| Date |
Closing |
Open |
Range |
Volume |
Fri 23 May 2025 |
125.60 (0.48%) |
126.95 |
123.50 - 129.70 |
1.1328 times |
Fri 16 May 2025 |
125.00 (0.81%) |
125.00 |
122.20 - 126.80 |
1.1227 times |
Fri 09 May 2025 |
124.00 (1.64%) |
122.10 |
122.00 - 127.50 |
0.6682 times |
Fri 02 May 2025 |
122.00 (-2.32%) |
124.40 |
120.60 - 132.00 |
0.8594 times |
Fri 25 April 2025 |
124.90 (1.3%) |
125.80 |
121.15 - 129.00 |
0.9562 times |
Thu 17 April 2025 |
123.30 (3.09%) |
121.00 |
120.30 - 125.80 |
0.7339 times |
Fri 11 April 2025 |
119.60 (-6.64%) |
131.00 |
117.45 - 131.00 |
0.9552 times |
Fri 04 April 2025 |
128.10 (3.26%) |
127.60 |
120.00 - 135.00 |
0.511 times |
Fri 28 March 2025 |
124.05 (-4.65%) |
130.10 |
120.50 - 132.00 |
0.6001 times |
Fri 21 March 2025 |
130.10 (-6.4%) |
148.40 |
127.25 - 148.40 |
2.4605 times |
Thu 13 March 2025 |
139.00 (-6.4%) |
154.75 |
136.25 - 154.75 |
0.3874 times |
Monthly price and charts MysPetro Strong monthly Stock price targets for MysPetro 506734 are 118.95 and 127.65 | Monthly Target 1 | 116.73 | | Monthly Target 2 | 121.17 | | Monthly Target 3 | 125.43333333333 | | Monthly Target 4 | 129.87 | | Monthly Target 5 | 134.13 |
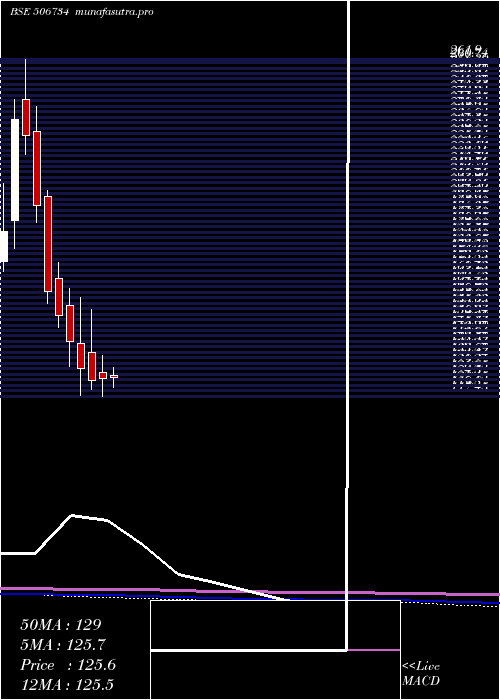
Monthly price and volumes Mys Petro
| Date |
Closing |
Open |
Range |
Volume |
Fri 23 May 2025 |
125.60 (0.52%) |
126.50 |
121.00 - 129.70 |
0.4305 times |
Wed 30 April 2025 |
124.95 (0.73%) |
127.60 |
117.45 - 135.00 |
0.5537 times |
Fri 28 March 2025 |
124.05 (-3.99%) |
136.00 |
120.50 - 154.75 |
0.638 times |
Fri 28 February 2025 |
129.20 (-8.37%) |
140.00 |
117.60 - 159.90 |
0.3644 times |
Fri 31 January 2025 |
141.00 (-7.3%) |
156.40 |
130.00 - 163.50 |
0.6809 times |
Tue 31 December 2024 |
152.10 (-6.31%) |
167.80 |
146.80 - 174.80 |
0.8136 times |
Fri 29 November 2024 |
162.35 (-18.56%) |
203.35 |
157.15 - 205.80 |
0.9283 times |
Thu 31 October 2024 |
199.35 (-13.14%) |
231.00 |
192.05 - 242.00 |
0.622 times |
Mon 30 September 2024 |
229.50 (-2.92%) |
245.00 |
221.10 - 261.90 |
1.6664 times |
Fri 30 August 2024 |
236.40 (25.58%) |
192.90 |
181.00 - 244.80 |
3.3023 times |
Wed 31 July 2024 |
188.25 (7.79%) |
172.00 |
162.00 - 208.85 |
1.8347 times |
DMA SMA EMA moving averages of Mys Petro 506734
DMA (daily moving average) of Mys Petro 506734
| DMA period | DMA value | | 5 day DMA | 126.19 | | 12 day DMA | 125.35 | | 20 day DMA | 124.77 | | 35 day DMA | 124.58 | | 50 day DMA | 127.77 | | 100 day DMA | 136.96 | | 150 day DMA | 154.99 | | 200 day DMA | 170.4 | EMA (exponential moving average) of Mys Petro 506734
| EMA period | EMA current | EMA prev | EMA prev2 | | 5 day EMA | 125.74 | 125.81 | 126.14 | | 12 day EMA | 125.46 | 125.43 | 125.48 | | 20 day EMA | 125.43 | 125.41 | 125.44 | | 35 day EMA | 126.78 | 126.85 | 126.95 | | 50 day EMA | 128.16 | 128.26 | 128.39 |
SMA (simple moving average) of Mys Petro 506734
| SMA period | SMA current | SMA prev | SMA prev2 | | 5 day SMA | 126.19 | 126.07 | 126.04 | | 12 day SMA | 125.35 | 125.42 | 125.41 | | 20 day SMA | 124.77 | 124.76 | 124.71 | | 35 day SMA | 124.58 | 124.64 | 124.78 | | 50 day SMA | 127.77 | 127.84 | 127.99 | | 100 day SMA | 136.96 | 137.28 | 137.72 | | 150 day SMA | 154.99 | 155.63 | 156.26 | | 200 day SMA | 170.4 | 170.63 | 170.84 |
|
|
