UnichemLab 506690 full analysis,charts,indicators,moving averages,SMA,DMA,EMA,ADX,MACD,RSIUnichem Lab 506690 WideScreen charts, DMA,SMA,EMA technical analysis, forecast prediction, by indicators ADX,MACD,RSI,CCI BSE stock exchange
Daily price and charts and targets UnichemLab Strong Daily Stock price targets for UnichemLab 506690 are 457.45 and 470 | Daily Target 1 | 454.78 | | Daily Target 2 | 460.12 | | Daily Target 3 | 467.33333333333 | | Daily Target 4 | 472.67 | | Daily Target 5 | 479.88 |
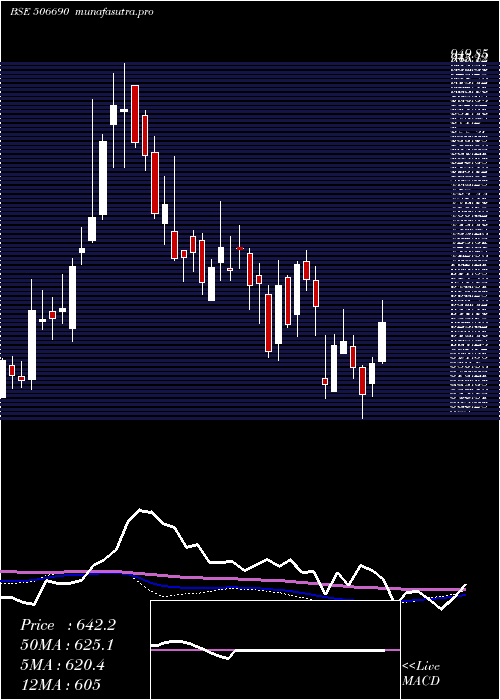
Daily price and volume Unichem Lab
| Date |
Closing |
Open |
Range |
Volume |
Tue 21 October 2025 |
465.45 (-0.16%) |
474.55 |
462.00 - 474.55 |
0.689 times |
Mon 20 October 2025 |
466.20 (0.36%) |
468.05 |
461.20 - 475.00 |
0.8425 times |
Fri 17 October 2025 |
464.55 (-1.19%) |
471.40 |
455.25 - 473.15 |
2.3842 times |
Thu 16 October 2025 |
470.15 (-0.21%) |
475.00 |
467.50 - 478.35 |
0.2399 times |
Wed 15 October 2025 |
471.15 (0.11%) |
473.85 |
464.85 - 480.00 |
1.8663 times |
Tue 14 October 2025 |
470.65 (-1.35%) |
481.00 |
470.00 - 481.00 |
1.2795 times |
Mon 13 October 2025 |
477.10 (-1.74%) |
481.05 |
473.45 - 481.05 |
0.4129 times |
Fri 10 October 2025 |
485.55 (-0.1%) |
485.75 |
483.60 - 486.70 |
0.7839 times |
Thu 09 October 2025 |
486.05 (3.64%) |
472.00 |
470.00 - 491.65 |
0.7235 times |
Wed 08 October 2025 |
469.00 (-0.87%) |
480.30 |
468.00 - 481.55 |
0.7783 times |
Tue 07 October 2025 |
473.10 (-2.86%) |
480.00 |
469.30 - 484.70 |
1.4878 times |

Weekly price and charts UnichemLab Strong weekly Stock price targets for UnichemLab 506690 are 456.43 and 470.23 | Weekly Target 1 | 453.42 | | Weekly Target 2 | 459.43 | | Weekly Target 3 | 467.21666666667 | | Weekly Target 4 | 473.23 | | Weekly Target 5 | 481.02 |
Weekly price and volumes for Unichem Lab
| Date |
Closing |
Open |
Range |
Volume |
Tue 21 October 2025 |
465.45 (0.19%) |
468.05 |
461.20 - 475.00 |
0.1637 times |
Fri 17 October 2025 |
464.55 (-4.32%) |
481.05 |
455.25 - 481.05 |
0.6608 times |
Fri 10 October 2025 |
485.55 (-1.18%) |
491.00 |
468.00 - 491.65 |
0.5353 times |
Fri 03 October 2025 |
491.35 (2.64%) |
481.00 |
456.10 - 494.40 |
0.8847 times |
Fri 26 September 2025 |
478.70 (-4.8%) |
502.15 |
478.00 - 505.00 |
0.4703 times |
Fri 19 September 2025 |
502.85 (-0.33%) |
507.70 |
475.80 - 514.80 |
2.7104 times |
Fri 12 September 2025 |
504.50 (1.17%) |
501.55 |
490.00 - 510.50 |
0.7436 times |
Fri 05 September 2025 |
498.65 (-0.64%) |
505.95 |
493.00 - 513.70 |
0.3942 times |
Fri 29 August 2025 |
501.85 (-0.38%) |
503.00 |
497.80 - 550.00 |
2.223 times |
Fri 22 August 2025 |
503.75 (-0.1%) |
510.00 |
496.35 - 521.50 |
1.2142 times |
Thu 14 August 2025 |
504.25 (1.56%) |
509.00 |
482.95 - 519.00 |
0.9666 times |
Monthly price and charts UnichemLab Strong monthly Stock price targets for UnichemLab 506690 are 460.35 and 499.5 | Monthly Target 1 | 432.55 | | Monthly Target 2 | 449 | | Monthly Target 3 | 471.7 | | Monthly Target 4 | 488.15 | | Monthly Target 5 | 510.85 |
Monthly price and volumes Unichem Lab
| Date |
Closing |
Open |
Range |
Volume |
Tue 21 October 2025 |
465.45 (0.71%) |
461.60 |
455.25 - 494.40 |
0.274 times |
Tue 30 September 2025 |
462.15 (-7.91%) |
505.95 |
456.10 - 514.80 |
0.7795 times |
Fri 29 August 2025 |
501.85 (-19.04%) |
625.65 |
482.95 - 625.70 |
1.4886 times |
Thu 31 July 2025 |
619.85 (5.08%) |
591.85 |
583.40 - 656.85 |
1.5622 times |
Mon 30 June 2025 |
589.90 (-1.54%) |
623.75 |
550.60 - 666.00 |
1.1872 times |
Fri 30 May 2025 |
599.10 (-0.75%) |
575.00 |
528.00 - 668.00 |
1.6998 times |
Wed 30 April 2025 |
603.60 (-12.88%) |
691.60 |
551.00 - 708.00 |
0.6717 times |
Fri 28 March 2025 |
692.80 (14.17%) |
617.05 |
596.10 - 727.95 |
0.8314 times |
Fri 28 February 2025 |
606.80 (-13.83%) |
729.95 |
600.45 - 757.40 |
1.0034 times |
Fri 31 January 2025 |
704.20 (-4.95%) |
729.00 |
667.65 - 785.85 |
0.5022 times |
Tue 31 December 2024 |
740.85 (-11.79%) |
844.00 |
690.40 - 863.00 |
1.1349 times |

DMA SMA EMA moving averages of Unichem Lab 506690
DMA (daily moving average) of Unichem Lab 506690
| DMA period | DMA value | | 5 day DMA | 467.5 | | 12 day DMA | 473.83 | | 20 day DMA | 477.33 | | 35 day DMA | 487.9 | | 50 day DMA | 493.2 | | 100 day DMA | 547.12 | | 150 day DMA | 573.12 | | 200 day DMA | 604.18 | EMA (exponential moving average) of Unichem Lab 506690
| EMA period | EMA current | EMA prev | EMA prev2 | | 5 day EMA | 467.84 | 469.04 | 470.46 | | 12 day EMA | 472.92 | 474.28 | 475.75 | | 20 day EMA | 478.07 | 479.4 | 480.79 | | 35 day EMA | 486.57 | 487.81 | 489.08 | | 50 day EMA | 495.46 | 496.68 | 497.92 |
SMA (simple moving average) of Unichem Lab 506690
| SMA period | SMA current | SMA prev | SMA prev2 | | 5 day SMA | 467.5 | 468.54 | 470.72 | | 12 day SMA | 473.83 | 475.99 | 477.41 | | 20 day SMA | 477.33 | 478.7 | 480.53 | | 35 day SMA | 487.9 | 488.94 | 489.96 | | 50 day SMA | 493.2 | 494.28 | 495.64 | | 100 day SMA | 547.12 | 548.53 | 549.82 | | 150 day SMA | 573.12 | 574.34 | 575.47 | | 200 day SMA | 604.18 | 605.43 | 606.69 |
|
|
