PhilCarbon 506590 full analysis,charts,indicators,moving averages,SMA,DMA,EMA,ADX,MACD,RSIPhil Carbon 506590 WideScreen charts, DMA,SMA,EMA technical analysis, forecast prediction, by indicators ADX,MACD,RSI,CCI BSE stock exchange
Daily price and charts and targets PhilCarbon Strong Daily Stock price targets for PhilCarbon 506590 are 379.85 and 389.1 | Daily Target 1 | 372.28 | | Daily Target 2 | 378.17 | | Daily Target 3 | 381.53333333333 | | Daily Target 4 | 387.42 | | Daily Target 5 | 390.78 |
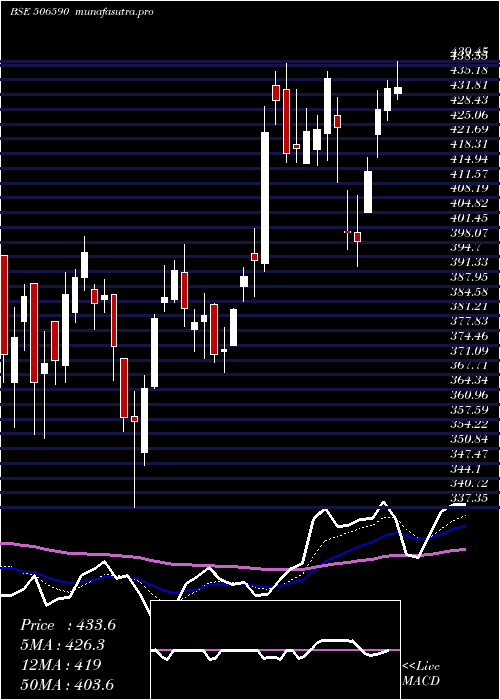
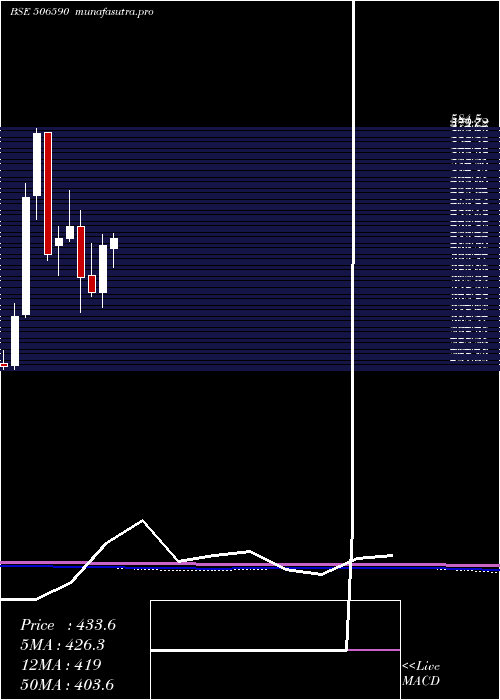
Daily price and volume Phil Carbon
| Date |
Closing |
Open |
Range |
Volume |
Wed 03 September 2025 |
384.05 (1.36%) |
381.35 |
375.65 - 384.90 |
0.6693 times |
Tue 02 September 2025 |
378.90 (1.09%) |
370.15 |
370.15 - 381.00 |
0.9011 times |
Mon 01 September 2025 |
374.80 (0.44%) |
372.75 |
370.90 - 378.50 |
1.4614 times |
Fri 29 August 2025 |
373.15 (0.13%) |
375.00 |
369.20 - 380.10 |
1.1515 times |
Thu 28 August 2025 |
372.65 (-0.94%) |
375.25 |
370.80 - 380.00 |
1.0293 times |
Tue 26 August 2025 |
376.20 (-1.23%) |
377.75 |
373.30 - 382.00 |
0.7155 times |
Mon 25 August 2025 |
380.90 (0.2%) |
381.20 |
380.15 - 385.45 |
0.4756 times |
Fri 22 August 2025 |
380.15 (-0.98%) |
383.00 |
379.00 - 387.25 |
1.4755 times |
Thu 21 August 2025 |
383.90 (-1.46%) |
390.35 |
383.55 - 393.55 |
0.8574 times |
Wed 20 August 2025 |
389.60 (-0.98%) |
391.05 |
388.50 - 394.55 |
1.2633 times |
Tue 19 August 2025 |
393.45 (0.11%) |
394.80 |
391.00 - 396.00 |
1.767 times |
Weekly price and charts PhilCarbon Strong weekly Stock price targets for PhilCarbon 506590 are 377.1 and 391.85 | Weekly Target 1 | 364.95 | | Weekly Target 2 | 374.5 | | Weekly Target 3 | 379.7 | | Weekly Target 4 | 389.25 | | Weekly Target 5 | 394.45 |
Weekly price and volumes for Phil Carbon
| Date |
Closing |
Open |
Range |
Volume |
Wed 03 September 2025 |
384.05 (2.92%) |
372.75 |
370.15 - 384.90 |
0.2502 times |
Fri 29 August 2025 |
373.15 (-1.84%) |
381.20 |
369.20 - 385.45 |
0.2782 times |
Fri 22 August 2025 |
380.15 (0.5%) |
382.00 |
379.00 - 396.00 |
0.7552 times |
Thu 14 August 2025 |
378.25 (0.79%) |
375.00 |
364.45 - 390.90 |
0.8637 times |
Fri 08 August 2025 |
375.30 (-6.2%) |
402.65 |
372.85 - 402.65 |
0.5627 times |
Fri 01 August 2025 |
400.10 (3.04%) |
388.00 |
381.25 - 403.55 |
1.1978 times |
Fri 25 July 2025 |
388.30 (-7.6%) |
423.20 |
385.10 - 430.00 |
1.3932 times |
Fri 18 July 2025 |
420.25 (-0.47%) |
421.05 |
412.75 - 429.75 |
1.3921 times |
Fri 11 July 2025 |
422.25 (3.23%) |
409.35 |
398.00 - 437.40 |
2.789 times |
Fri 04 July 2025 |
409.05 (-1.88%) |
418.10 |
407.25 - 421.70 |
0.5179 times |
Fri 27 June 2025 |
416.90 (7.49%) |
385.50 |
384.45 - 425.00 |
1.9206 times |

Monthly price and charts PhilCarbon Strong monthly Stock price targets for PhilCarbon 506590 are 377.1 and 391.85 | Monthly Target 1 | 364.95 | | Monthly Target 2 | 374.5 | | Monthly Target 3 | 379.7 | | Monthly Target 4 | 389.25 | | Monthly Target 5 | 394.45 |
Monthly price and volumes Phil Carbon
| Date |
Closing |
Open |
Range |
Volume |
Wed 03 September 2025 |
384.05 (2.92%) |
372.75 |
370.15 - 384.90 |
0.0435 times |
Fri 29 August 2025 |
373.15 (-5.21%) |
394.90 |
364.45 - 403.55 |
0.4702 times |
Thu 31 July 2025 |
393.65 (-6.05%) |
420.00 |
381.25 - 437.40 |
1.205 times |
Mon 30 June 2025 |
419.00 (5.18%) |
397.80 |
380.00 - 432.70 |
1.1305 times |
Fri 30 May 2025 |
398.35 (11.02%) |
358.50 |
346.35 - 411.95 |
0.9558 times |
Wed 30 April 2025 |
358.80 (-15.25%) |
419.20 |
355.55 - 443.00 |
1.0022 times |
Fri 28 March 2025 |
423.35 (18.27%) |
358.20 |
337.35 - 439.00 |
0.9185 times |
Fri 28 February 2025 |
357.95 (-5.6%) |
381.50 |
353.15 - 426.35 |
1.0462 times |
Fri 31 January 2025 |
379.20 (-15.72%) |
449.95 |
331.20 - 471.45 |
1.906 times |
Tue 31 December 2024 |
449.95 (3.77%) |
433.05 |
428.20 - 498.55 |
1.3222 times |
Fri 29 November 2024 |
433.60 (5.55%) |
423.95 |
381.45 - 449.75 |
1.4524 times |
DMA SMA EMA moving averages of Phil Carbon 506590
DMA (daily moving average) of Phil Carbon 506590
| DMA period | DMA value | | 5 day DMA | 376.71 | | 12 day DMA | 381.73 | | 20 day DMA | 381.83 | | 35 day DMA | 392.15 | | 50 day DMA | 398.71 | | 100 day DMA | 397.7 | | 150 day DMA | 393.66 | | 200 day DMA | 403.52 | EMA (exponential moving average) of Phil Carbon 506590
| EMA period | EMA current | EMA prev | EMA prev2 | | 5 day EMA | 379.3 | 376.93 | 375.94 | | 12 day EMA | 380.49 | 379.84 | 380.01 | | 20 day EMA | 383.52 | 383.46 | 383.94 | | 35 day EMA | 389.38 | 389.69 | 390.33 | | 50 day EMA | 395.99 | 396.48 | 397.2 |
SMA (simple moving average) of Phil Carbon 506590
| SMA period | SMA current | SMA prev | SMA prev2 | | 5 day SMA | 376.71 | 375.14 | 375.54 | | 12 day SMA | 381.73 | 381.25 | 381.35 | | 20 day SMA | 381.83 | 382.67 | 383.73 | | 35 day SMA | 392.15 | 393.03 | 394.27 | | 50 day SMA | 398.71 | 398.79 | 398.97 | | 100 day SMA | 397.7 | 398.22 | 398.67 | | 150 day SMA | 393.66 | 393.55 | 393.42 | | 200 day SMA | 403.52 | 403.69 | 403.96 |
|
|
